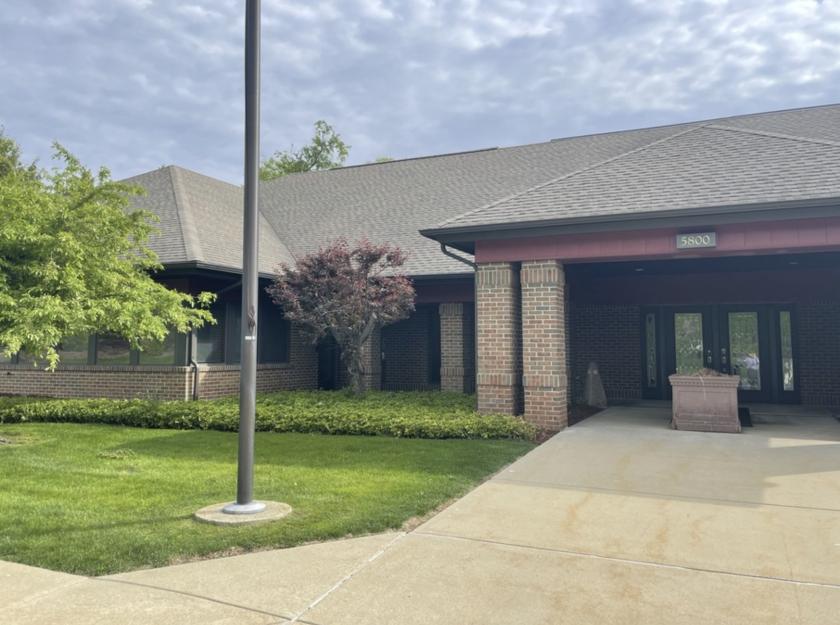
1-Mile | 3-Miles | 5-Miles | ||
---|---|---|---|---|
Total Population | 717 | 14,976 | 68,944 | |
Population Median Age | 42 | 40 | 37 | |
Population by Age | 0-9 Yrs | 49 (6%) | 2006 (13%) | 9246 (13%) |
10-19 Yrs | 98 (13%) | 1628 (10%) | 10572 (15%) | |
20-29 Yrs | 46 (6%) | 1687 (11%) | 10896 (15%) | |
30-39 Yrs | 105 (14%) | 2146 (14%) | 8423 (12%) | |
40-49 Yrs | 185 (25%) | 2205 (14%) | 7884 (11%) | |
50-59 Yrs | 75 (10%) | 1812 (12%) | 7817 (11%) | |
60-69 Yrs | 88 (12%) | 1850 (12%) | 7513 (10%) | |
70+ Yrs | 71 (9%) | 1643 (10%) | 6593 (9%) | |
Median HH Income | $81,484 | $51,953 | $43,697 | |
Total Household Income | < 24K | 33 (11%) | 1265 (20%) | 6591 (27%) |
25-49K | 37 (13%) | 1656 (27%) | 6743 (27%) | |
50-74K | 49 (17%) | 1018 (16%) | 4515 (18%) | |
75-99K | 86 (30%) | 828 (13%) | 2546 (10%) | |
100-199K | 59 (20%) | 1078 (17%) | 3261 (13%) | |
200K+ | 19 (6%) | 193 (3%) | 643 (2%) | |
Highest Education Level | No Diploma | 41 | 1224 | 7270 |
Diploma or GED | 182 | 3716 | 14595 | |
Some College | 125 | 2148 | 8474 | |
Assoc. Degree | 34 | 819 | 3078 | |
Bachelors Degree | 120 | 1947 | 5802 | |
Higher Degree | 66 | 877 | 3813 | |
Total Housing Units | 284 | 6,844 | 28,459 | |
--Owner-Occupied | 277 | 4,189 | 16,326 | |
--Renter-Occupied | 6 | 1,849 | 7,973 | |
Owner-Occupied Values | < 100K | 31 | 1592 | 8466 |
100-199K | 202 | 1836 | 5689 | |
200-299K | 27 | 473 | 1369 | |
300-399K | 5 | 103 | 317 | |
400-499K | 0 | 68 | 184 | |
500K+ | 12 | 117 | 301 | |
Total Working Age Population | 598 | 11,767 | 53,891 | |
In Work Force | 392 | 7,874 | 33,291 | |
Not In Work Force | 206 | 3,892 | 20,600 | |
Workforce Employed | 380 | 7,505 | 31,237 | |
Workforce Unemployed | 12 | 368 | 2,032 | |
Civlian Workforce | 392 | 7,874 | 33,269 | |
Military Workforce | 0 | 1 | 22 | |
Total Households | 283 | 6,038 | 24,299 | |
Family Households | 186 | 3,792 | 15,413 | |
Non-Family Households | 97 | 2,246 | 8,887 | |
Married Couple | 171 | 2,719 | 10,227 | |
Other Family | 15 | 1,073 | 5,186 | |
Married w/Child | 75 | 1,065 | 4,013 | |
Single Male w/Child | 4 | 66 | 483 | |
Single Female w/Child | 3 | 558 | 2,656 |
Population Change Last Two Decades - Plus Projection
2000 | % | 2010 | % | 2020 | % | 2030 | |
---|---|---|---|---|---|---|---|
Indiana | 6,080,485 | +7 | 6,483,802 | +4 | 6,738,573 | +4 | 7,014,880 |
St. Joseph County | 265,559 | +1 | 266,931 | +1 | 269,113 | +1 | 271,912 |
Michigan | 9,938,444 | -1 | 9,883,640 | +1 | 10,023,423 | +4 | 10,424,510 |
Berrien County | 162,453 | -3 | 156,813 | -2 | 153,154 | +2 | 156,590 |
Total Working Age Population:
Total Households:
Total Working Age Population:
Total Households:
Total Working Age Population:
Total Households: