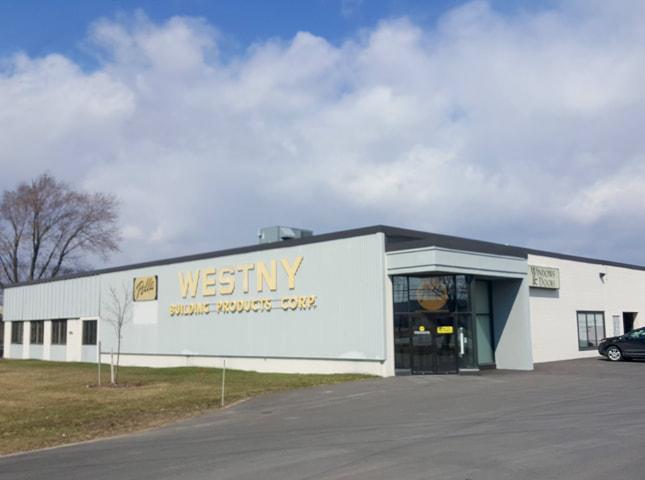
1-Mile | 3-Miles | 5-Miles | ||
---|---|---|---|---|
Total Population | 6,700 | 76,354 | 241,974 | |
Population Median Age | 43 | 42 | 40 | |
Population by Age | 0-9 Yrs | 626 (9%) | 7718 (10%) | 27404 (11%) |
10-19 Yrs | 728 (10%) | 6995 (9%) | 29148 (12%) | |
20-29 Yrs | 835 (12%) | 11269 (14%) | 33779 (13%) | |
30-39 Yrs | 957 (14%) | 10734 (14%) | 31850 (13%) | |
40-49 Yrs | 672 (10%) | 8137 (10%) | 27347 (11%) | |
50-59 Yrs | 962 (14%) | 11057 (14%) | 34590 (14%) | |
60-69 Yrs | 797 (11%) | 9819 (12%) | 28516 (11%) | |
70+ Yrs | 1124 (16%) | 10625 (13%) | 29340 (12%) | |
Median HH Income | $60,474 | $54,349 | $52,423 | |
Total Household Income | < 24K | 476 (16%) | 6823 (19%) | 25151 (23%) |
25-49K | 758 (26%) | 9131 (26%) | 25327 (24%) | |
50-74K | 608 (20%) | 7102 (20%) | 19428 (18%) | |
75-99K | 374 (12%) | 4880 (14%) | 13271 (12%) | |
100-199K | 656 (22%) | 6092 (17%) | 18568 (17%) | |
200K+ | 25 (0%) | 543 (1%) | 3420 (3%) | |
Highest Education Level | No Diploma | 268 | 3693 | 14255 |
Diploma or GED | 2091 | 21113 | 53955 | |
Some College | 1019 | 12447 | 34489 | |
Assoc. Degree | 597 | 7167 | 20366 | |
Bachelors Degree | 648 | 8154 | 27731 | |
Higher Degree | 393 | 4466 | 19156 | |
Total Housing Units | 3,081 | 36,502 | 114,912 | |
--Owner-Occupied | 2,193 | 23,717 | 66,257 | |
--Renter-Occupied | 703 | 10,854 | 38,909 | |
Owner-Occupied Values | < 100K | 432 | 7863 | 23370 |
100-199K | 1688 | 14318 | 30986 | |
200-299K | 35 | 1063 | 7442 | |
300-399K | 0 | 204 | 2521 | |
400-499K | 8 | 37 | 677 | |
500K+ | 30 | 233 | 1260 | |
Total Working Age Population | 5,603 | 64,449 | 197,397 | |
In Work Force | 3,601 | 42,288 | 125,130 | |
Not In Work Force | 2,002 | 22,161 | 72,267 | |
Workforce Employed | 3,435 | 40,576 | 118,350 | |
Workforce Unemployed | 161 | 1,641 | 6,558 | |
Civlian Workforce | 3,596 | 42,216 | 124,908 | |
Military Workforce | 5 | 72 | 221 | |
Total Households | 2,896 | 34,571 | 105,166 | |
Family Households | 1,781 | 19,854 | 61,442 | |
Non-Family Households | 1,115 | 14,717 | 43,724 | |
Married Couple | 1,281 | 13,545 | 39,258 | |
Other Family | 500 | 6,309 | 22,183 | |
Married w/Child | 384 | 4,037 | 14,047 | |
Single Male w/Child | 97 | 822 | 2,118 | |
Single Female w/Child | 158 | 2,335 | 9,509 |
Population Change Last Two Decades - Plus Projection
2000 | % | 2010 | % | 2020 | % | 2030 | |
---|---|---|---|---|---|---|---|
New York | 18,976,457 | +2 | 19,378,102 | +4 | 20,146,131 | +2 | 20,604,030 |
Erie County | 950,265 | -3 | 919,040 | +2 | 936,084 | +1 | 949,073 |
Total Working Age Population:
Total Households:
Total Working Age Population:
Total Households:
Total Working Age Population:
Total Households: