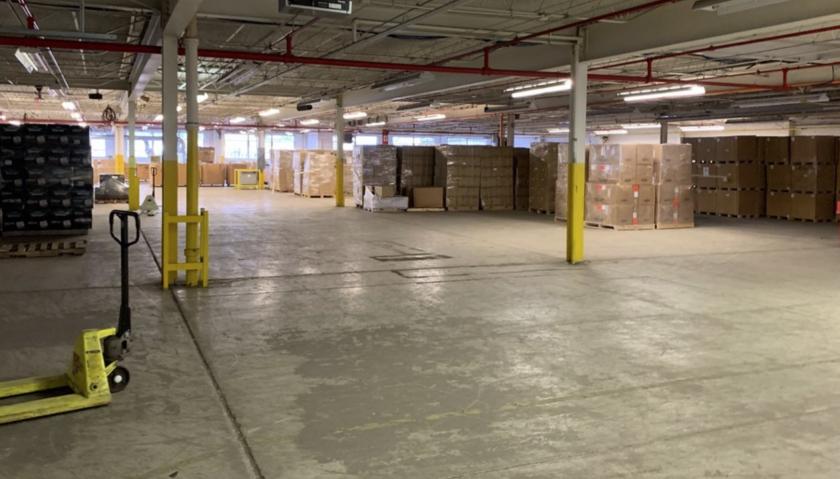
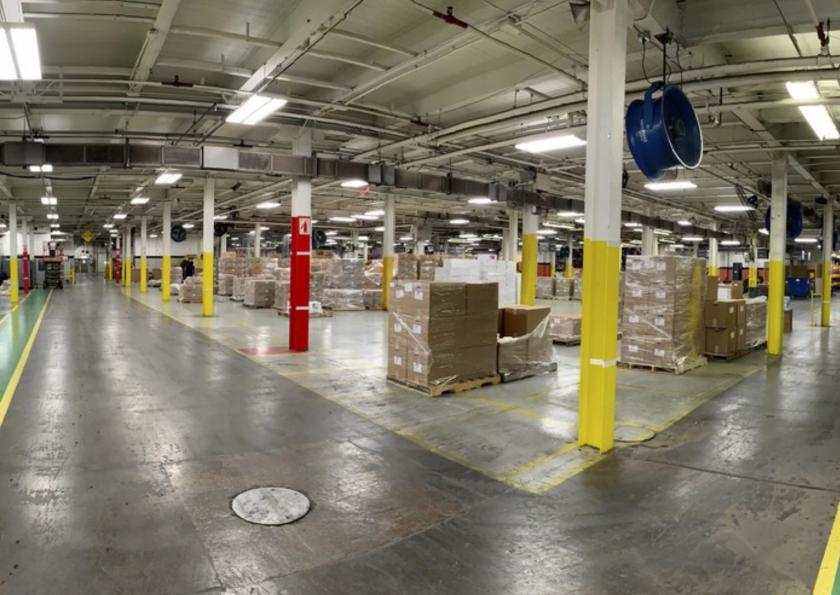
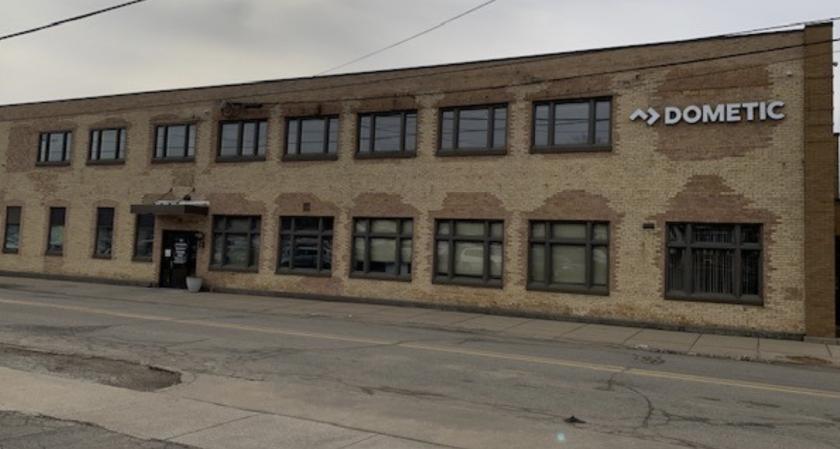
1-Mile | 3-Miles | 5-Miles | ||
---|---|---|---|---|
Total Population | 10,280 | 56,452 | 100,571 | |
Population Median Age | 37 | 37 | 37 | |
Population by Age | 0-9 Yrs | 1711 (16%) | 8836 (15%) | 15103 (15%) |
10-19 Yrs | 1358 (13%) | 7764 (13%) | 14490 (14%) | |
20-29 Yrs | 1546 (15%) | 7704 (13%) | 12637 (12%) | |
30-39 Yrs | 1254 (12%) | 7068 (12%) | 12537 (12%) | |
40-49 Yrs | 1053 (10%) | 6526 (11%) | 12257 (12%) | |
50-59 Yrs | 1209 (11%) | 7591 (13%) | 13453 (13%) | |
60-69 Yrs | 986 (9%) | 5465 (9%) | 10453 (10%) | |
70+ Yrs | 1164 (11%) | 5499 (9%) | 9641 (9%) | |
Median HH Income | $35,377 | $45,642 | $50,592 | |
Total Household Income | < 24K | 1384 (34%) | 6031 (28%) | 8838 (23%) |
25-49K | 1307 (32%) | 5851 (27%) | 9663 (25%) | |
50-74K | 602 (14%) | 4228 (19%) | 7400 (19%) | |
75-99K | 260 (6%) | 2633 (12%) | 5172 (13%) | |
100-199K | 478 (11%) | 2480 (11%) | 5438 (14%) | |
200K+ | 37 (0%) | 301 (1%) | 866 (2%) | |
Highest Education Level | No Diploma | 1733 | 8125 | 12210 |
Diploma or GED | 2087 | 12844 | 23488 | |
Some College | 1374 | 7368 | 13555 | |
Assoc. Degree | 361 | 2370 | 4526 | |
Bachelors Degree | 747 | 4050 | 7804 | |
Higher Degree | 337 | 1893 | 3598 | |
Total Housing Units | 4,767 | 24,969 | 42,595 | |
--Owner-Occupied | 1,985 | 12,921 | 24,807 | |
--Renter-Occupied | 2,085 | 8,603 | 12,570 | |
Owner-Occupied Values | < 100K | 1318 | 6083 | 8485 |
100-199K | 530 | 5357 | 11825 | |
200-299K | 41 | 785 | 2636 | |
300-399K | 10 | 317 | 1060 | |
400-499K | 0 | 24 | 141 | |
500K+ | 85 | 356 | 659 | |
Total Working Age Population | 7,854 | 42,709 | 76,697 | |
In Work Force | 4,678 | 27,305 | 49,342 | |
Not In Work Force | 3,176 | 15,404 | 27,356 | |
Workforce Employed | 4,316 | 25,275 | 46,452 | |
Workforce Unemployed | 362 | 2,029 | 2,869 | |
Civlian Workforce | 4,678 | 27,304 | 49,321 | |
Military Workforce | 0 | 1 | 21 | |
Total Households | 4,069 | 21,523 | 37,377 | |
Family Households | 2,195 | 13,018 | 24,267 | |
Non-Family Households | 1,874 | 8,506 | 13,110 | |
Married Couple | 1,216 | 8,276 | 16,696 | |
Other Family | 979 | 4,742 | 7,571 | |
Married w/Child | 448 | 3,444 | 6,724 | |
Single Male w/Child | 237 | 813 | 1,245 | |
Single Female w/Child | 395 | 2,181 | 3,426 |
Population Change Last Two Decades - Plus Projection
2000 | % | 2010 | % | 2020 | % | 2030 | |
---|---|---|---|---|---|---|---|
Indiana | 6,080,485 | +7 | 6,483,802 | +4 | 6,738,573 | +4 | 7,014,880 |
Elkhart County | 182,791 | +8 | 197,559 | +6 | 209,690 | +7 | 223,392 |
St. Joseph County | 265,559 | +1 | 266,931 | +1 | 269,113 | +1 | 271,912 |
Michigan | 9,938,444 | -1 | 9,883,640 | +1 | 10,023,423 | +4 | 10,424,510 |
Cass County | 51,104 | +2 | 52,293 | -2 | 51,383 | +3 | 53,143 |
Total Working Age Population:
Total Households:
Total Working Age Population:
Total Households:
Total Working Age Population:
Total Households: