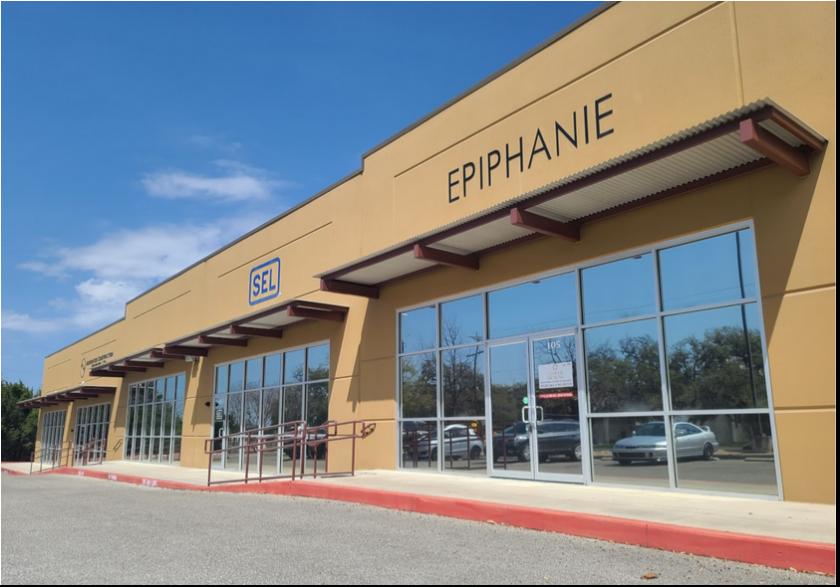
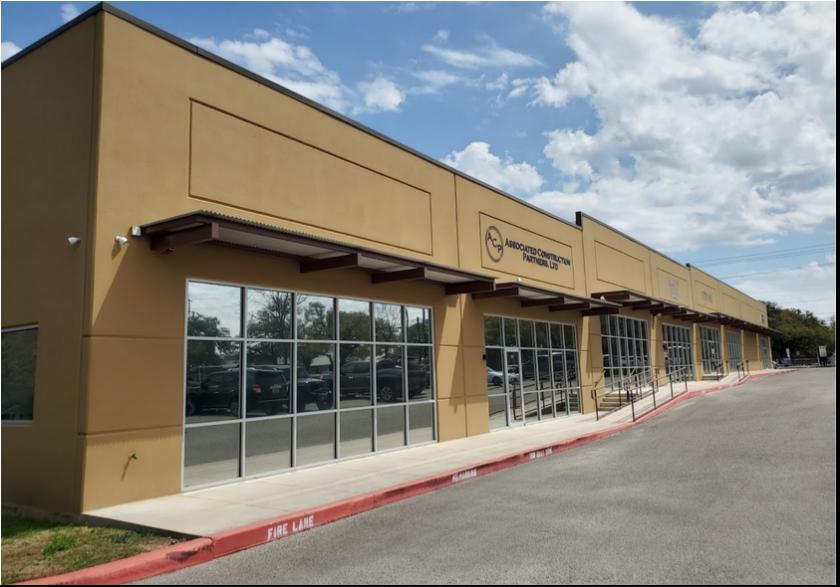
1-Mile | 3-Miles | 5-Miles | ||
---|---|---|---|---|
Total Population | 2,336 | 17,713 | 34,082 | |
Population Median Age | 45 | 39 | 38 | |
Population by Age | 0-9 Yrs | 314 (13%) | 2748 (15%) | 5526 (16%) |
10-19 Yrs | 287 (12%) | 2492 (14%) | 4781 (14%) | |
20-29 Yrs | 80 (3%) | 1325 (7%) | 2822 (8%) | |
30-39 Yrs | 274 (11%) | 2370 (13%) | 4403 (12%) | |
40-49 Yrs | 223 (9%) | 2310 (13%) | 4431 (13%) | |
50-59 Yrs | 309 (13%) | 2178 (12%) | 4402 (12%) | |
60-69 Yrs | 427 (18%) | 2106 (11%) | 3728 (10%) | |
70+ Yrs | 423 (18%) | 2184 (12%) | 3988 (11%) | |
Median HH Income | $106,282 | $113,449 | $108,596 | |
Total Household Income | < 24K | 87 (9%) | 445 (7%) | 965 (8%) |
25-49K | 151 (17%) | 677 (11%) | 1373 (12%) | |
50-74K | 50 (5%) | 686 (11%) | 1510 (13%) | |
75-99K | 118 (13%) | 760 (12%) | 1320 (11%) | |
100-199K | 260 (29%) | 2079 (35%) | 3794 (33%) | |
200K+ | 216 (24%) | 1290 (21%) | 2270 (20%) | |
Highest Education Level | No Diploma | 38 | 177 | 614 |
Diploma or GED | 241 | 1606 | 3433 | |
Some College | 394 | 2579 | 4993 | |
Assoc. Degree | 64 | 563 | 1339 | |
Bachelors Degree | 513 | 4235 | 7412 | |
Higher Degree | 430 | 2581 | 4601 | |
Total Housing Units | 966 | 6,333 | 11,986 | |
--Owner-Occupied | 850 | 5,287 | 9,457 | |
--Renter-Occupied | 33 | 651 | 1,776 | |
Owner-Occupied Values | < 100K | 39 | 153 | 295 |
100-199K | 30 | 272 | 562 | |
200-299K | 73 | 812 | 1886 | |
300-399K | 222 | 1482 | 2499 | |
400-499K | 305 | 1444 | 2172 | |
500K+ | 180 | 1123 | 2042 | |
Total Working Age Population | 1,848 | 13,383 | 25,532 | |
In Work Force | 894 | 8,037 | 15,783 | |
Not In Work Force | 954 | 5,346 | 9,749 | |
Workforce Employed | 883 | 7,806 | 15,323 | |
Workforce Unemployed | 11 | 215 | 413 | |
Civlian Workforce | 894 | 8,021 | 15,735 | |
Military Workforce | 0 | 16 | 48 | |
Total Households | 882 | 5,938 | 11,232 | |
Family Households | 632 | 4,664 | 8,831 | |
Non-Family Households | 251 | 1,273 | 2,401 | |
Married Couple | 558 | 4,022 | 7,442 | |
Other Family | 73 | 642 | 1,389 | |
Married w/Child | 169 | 1,735 | 3,376 | |
Single Male w/Child | 1 | 58 | 153 | |
Single Female w/Child | 45 | 288 | 606 |
Population Change Last Two Decades - Plus Projection
2000 | % | 2010 | % | 2020 | % | 2030 | |
---|---|---|---|---|---|---|---|
Texas | 20,851,820 | +21 | 25,145,561 | +18 | 29,677,668 | +18 | 34,894,452 |
Bexar County | 1,392,931 | +23 | 1,714,773 | +22 | 2,093,502 | +20 | 2,502,617 |
Comal County | 78,021 | +39 | 108,472 | +36 | 147,330 | +39 | 204,873 |
Kendall County | 23,743 | +41 | 33,410 | +39 | 46,278 | +46 | 67,443 |
Total Working Age Population:
Total Households:
Total Working Age Population:
Total Households:
Total Working Age Population:
Total Households: