Industrial Properties
79-1 US-6 Valparaiso, IN 46383
79-1 US-6 Valparaiso, IN 46383
Details & Description
Property Highlights
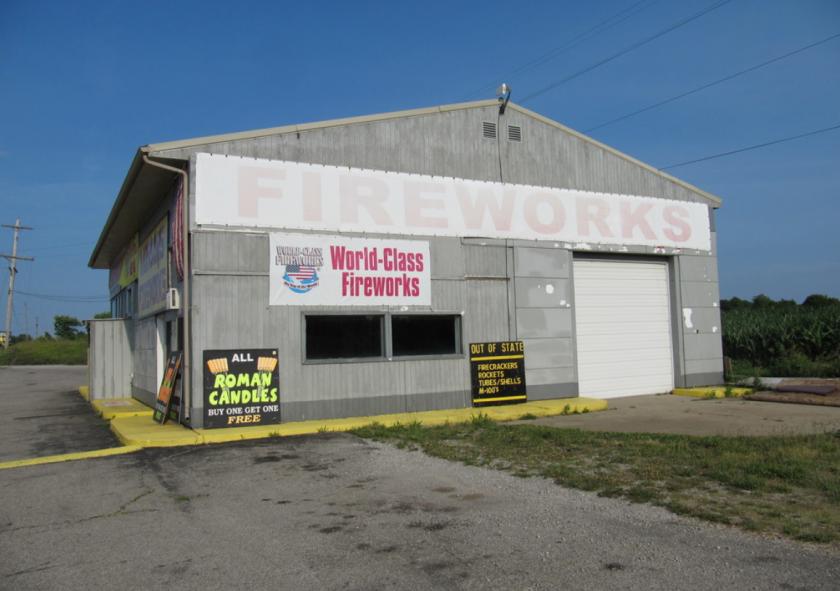
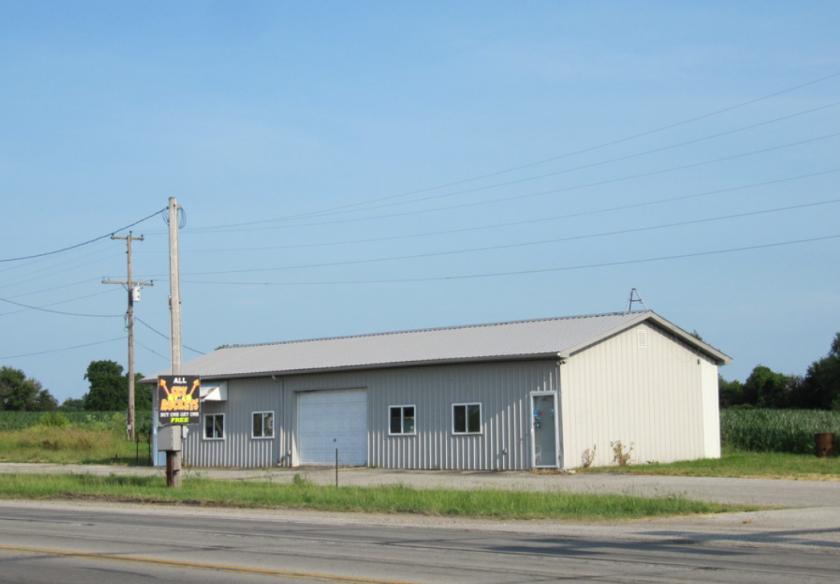
- • 1,512 2,160 SF buildings
- • Direct access from US 6
- • Private parking on a paved lot
Listing Agents

Stanley Phillips
O: 260-423-4311
sphillips@bradleyco.com
O: 260-423-4311
sphillips@bradleyco.com
While we strive to provide the most accurate information, all listing information, and demographic data, is provided by third-parties. As such, MyEListing will not be responsible for the accuracy of the information. It is strongly recommended that you verify all information with the listing agent, and any relevant agencies, prior to making any decisions.