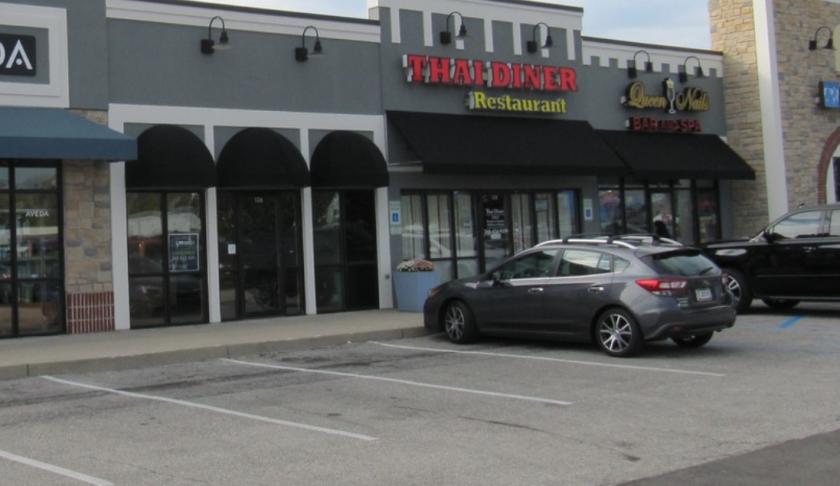
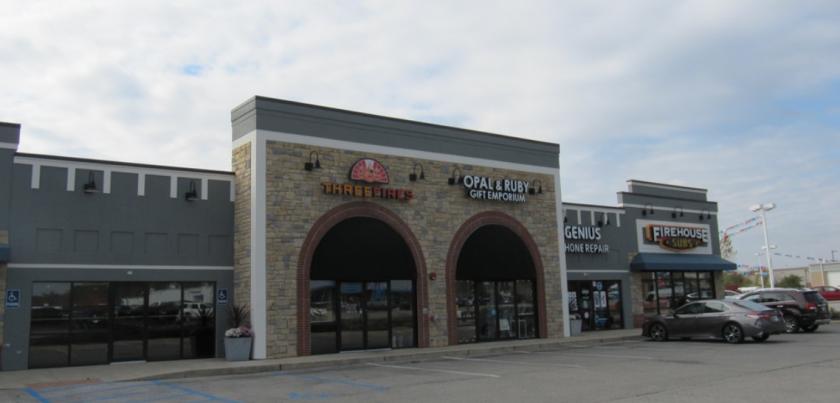
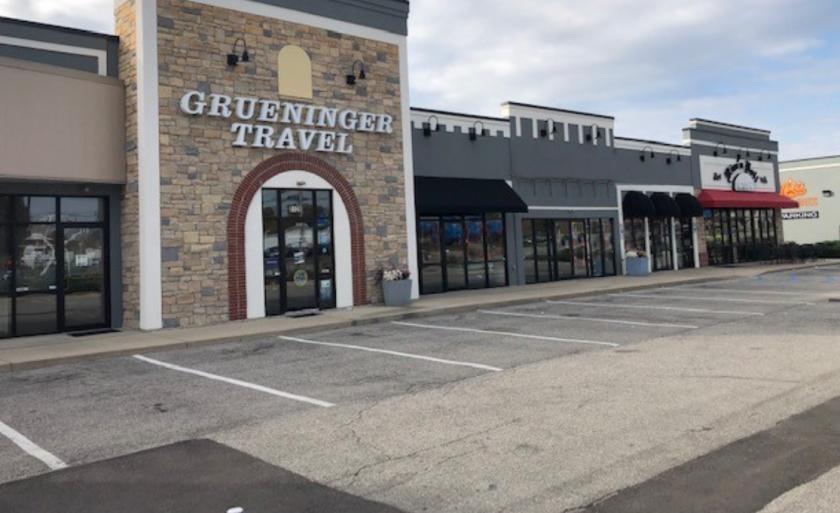
1-Mile | 3-Miles | 5-Miles | ||
---|---|---|---|---|
Total Population | 3,829 | 38,094 | 123,288 | |
Population Median Age | 38 | 37 | 36 | |
Population by Age | 0-9 Yrs | 518 (13%) | 5588 (14%) | 17759 (14%) |
10-19 Yrs | 309 (8%) | 4548 (11%) | 16661 (13%) | |
20-29 Yrs | 771 (20%) | 5733 (15%) | 18758 (15%) | |
30-39 Yrs | 542 (14%) | 5312 (13%) | 17022 (13%) | |
40-49 Yrs | 418 (10%) | 4823 (12%) | 14730 (11%) | |
50-59 Yrs | 409 (10%) | 4722 (12%) | 15447 (12%) | |
60-69 Yrs | 456 (11%) | 4211 (11%) | 13075 (10%) | |
70+ Yrs | 406 (10%) | 3157 (8%) | 9836 (7%) | |
Median HH Income | $43,316 | $50,485 | $46,769 | |
Total Household Income | < 24K | 475 (24%) | 3333 (20%) | 12311 (24%) |
25-49K | 608 (31%) | 4620 (28%) | 14596 (28%) | |
50-74K | 394 (20%) | 3115 (19%) | 9272 (18%) | |
75-99K | 302 (15%) | 1890 (11%) | 5928 (11%) | |
100-199K | 159 (8%) | 2553 (15%) | 6732 (13%) | |
200K+ | 10 (0%) | 525 (3%) | 1669 (3%) | |
Highest Education Level | No Diploma | 194 | 2585 | 9684 |
Diploma or GED | 950 | 7804 | 24282 | |
Some College | 550 | 5015 | 16892 | |
Assoc. Degree | 354 | 2616 | 7807 | |
Bachelors Degree | 435 | 4699 | 14208 | |
Higher Degree | 247 | 2635 | 7688 | |
Total Housing Units | 2,079 | 17,530 | 56,375 | |
--Owner-Occupied | 744 | 9,836 | 30,155 | |
--Renter-Occupied | 1,203 | 6,201 | 20,352 | |
Owner-Occupied Values | < 100K | 312 | 3718 | 14045 |
100-199K | 383 | 4264 | 11258 | |
200-299K | 21 | 1166 | 3002 | |
300-399K | 14 | 398 | 843 | |
400-499K | 6 | 194 | 396 | |
500K+ | 8 | 95 | 612 | |
Total Working Age Population | 3,096 | 29,652 | 95,246 | |
In Work Force | 2,142 | 20,532 | 63,741 | |
Not In Work Force | 953 | 9,120 | 31,505 | |
Workforce Employed | 2,094 | 19,589 | 60,186 | |
Workforce Unemployed | 48 | 913 | 3,506 | |
Civlian Workforce | 2,142 | 20,502 | 63,693 | |
Military Workforce | 0 | 29 | 48 | |
Total Households | 1,947 | 16,036 | 50,508 | |
Family Households | 864 | 9,275 | 29,610 | |
Non-Family Households | 1,083 | 6,761 | 20,898 | |
Married Couple | 536 | 6,405 | 19,539 | |
Other Family | 328 | 2,870 | 10,072 | |
Married w/Child | 137 | 2,690 | 7,898 | |
Single Male w/Child | 8 | 377 | 1,413 | |
Single Female w/Child | 199 | 1,452 | 4,917 |
Population Change Last Two Decades - Plus Projection
2000 | % | 2010 | % | 2020 | % | 2030 | |
---|---|---|---|---|---|---|---|
Indiana | 6,080,485 | +7 | 6,483,802 | +4 | 6,738,573 | +4 | 7,014,880 |
Allen County | 331,849 | +7 | 355,329 | +7 | 379,671 | +6 | 402,948 |
Total Working Age Population:
Total Households:
Total Working Age Population:
Total Households:
Total Working Age Population:
Total Households: