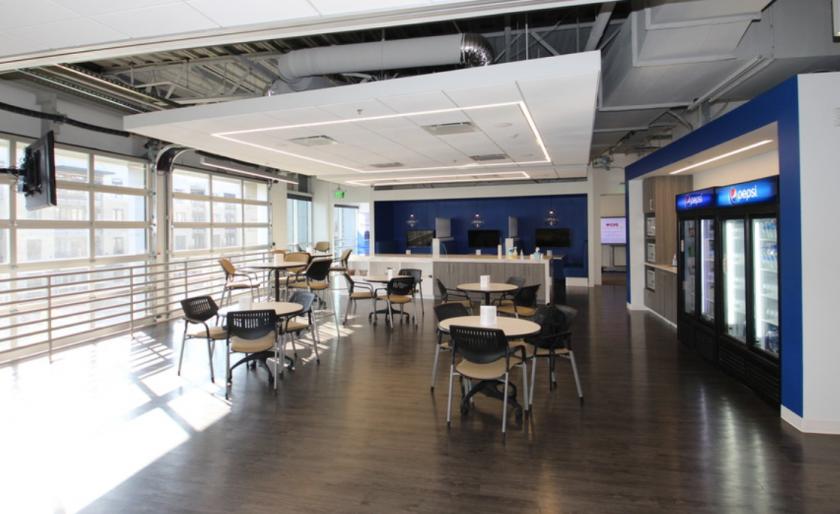
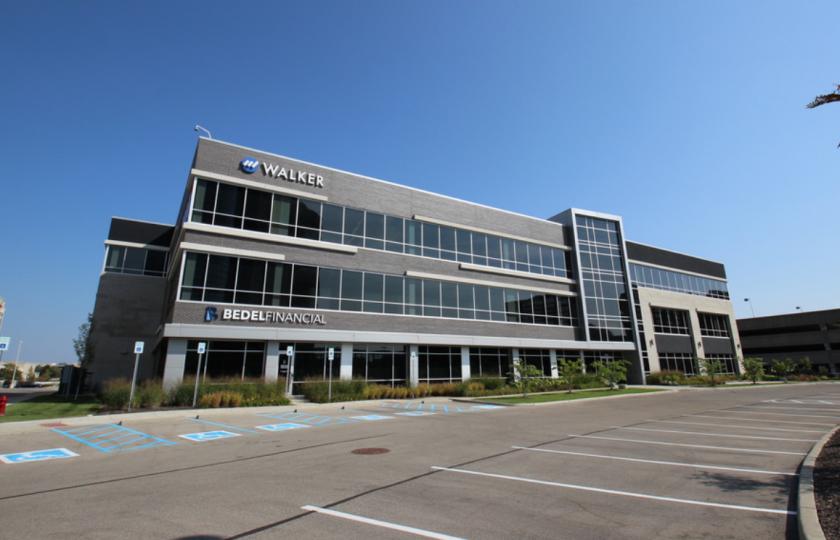
1-Mile | 3-Miles | 5-Miles | ||
---|---|---|---|---|
Total Population | 5,425 | 57,832 | 183,286 | |
Population Median Age | 43 | 41 | 40 | |
Population by Age | 0-9 Yrs | 173 (3%) | 5272 (9%) | 20212 (11%) |
10-19 Yrs | 388 (7%) | 6072 (10%) | 20397 (11%) | |
20-29 Yrs | 1437 (26%) | 9428 (16%) | 28245 (15%) | |
30-39 Yrs | 811 (14%) | 8205 (14%) | 27303 (14%) | |
40-49 Yrs | 642 (11%) | 7491 (12%) | 22596 (12%) | |
50-59 Yrs | 520 (9%) | 6924 (11%) | 22894 (12%) | |
60-69 Yrs | 660 (12%) | 7170 (12%) | 21126 (11%) | |
70+ Yrs | 795 (14%) | 7270 (12%) | 20514 (11%) | |
Median HH Income | $62,591 | $70,964 | $70,626 | |
Total Household Income | < 24K | 483 (16%) | 3901 (14%) | 11366 (13%) |
25-49K | 791 (26%) | 6157 (22%) | 18253 (22%) | |
50-74K | 386 (13%) | 4278 (15%) | 13681 (16%) | |
75-99K | 293 (9%) | 3536 (12%) | 10138 (12%) | |
100-199K | 720 (24%) | 6699 (24%) | 19726 (24%) | |
200K+ | 280 (9%) | 2754 (10%) | 8836 (10%) | |
Highest Education Level | No Diploma | 77 | 1620 | 4953 |
Diploma or GED | 607 | 6599 | 18192 | |
Some College | 676 | 6798 | 22157 | |
Assoc. Degree | 330 | 2774 | 8377 | |
Bachelors Degree | 1821 | 15914 | 48716 | |
Higher Degree | 915 | 9450 | 29375 | |
Total Housing Units | 3,291 | 29,618 | 88,338 | |
--Owner-Occupied | 1,014 | 14,686 | 47,273 | |
--Renter-Occupied | 1,939 | 12,640 | 34,727 | |
Owner-Occupied Values | < 100K | 20 | 711 | 2162 |
100-199K | 298 | 5355 | 17867 | |
200-299K | 257 | 3793 | 12522 | |
300-399K | 175 | 2253 | 7092 | |
400-499K | 84 | 1168 | 3006 | |
500K+ | 180 | 1406 | 4625 | |
Total Working Age Population | 4,990 | 48,465 | 149,727 | |
In Work Force | 3,626 | 34,486 | 106,983 | |
Not In Work Force | 1,364 | 13,979 | 42,744 | |
Workforce Employed | 3,473 | 33,453 | 103,740 | |
Workforce Unemployed | 153 | 992 | 3,152 | |
Civlian Workforce | 3,626 | 34,445 | 106,892 | |
Military Workforce | 1 | 41 | 91 | |
Total Households | 2,953 | 27,326 | 82,000 | |
Family Households | 974 | 13,038 | 42,875 | |
Non-Family Households | 1,979 | 14,288 | 39,124 | |
Married Couple | 781 | 10,675 | 34,125 | |
Other Family | 193 | 2,363 | 8,751 | |
Married w/Child | 176 | 3,811 | 13,031 | |
Single Male w/Child | 6 | 255 | 925 | |
Single Female w/Child | 76 | 1,031 | 4,322 |
Population Change Last Two Decades - Plus Projection
2000 | % | 2010 | % | 2020 | % | 2030 | |
---|---|---|---|---|---|---|---|
Indiana | 6,080,485 | +7 | 6,483,802 | +4 | 6,738,573 | +4 | 7,014,880 |
Hamilton County | 182,740 | +50 | 274,569 | +25 | 343,179 | +22 | 417,754 |
Marion County | 860,454 | +5 | 903,393 | +7 | 963,732 | +4 | 1,001,231 |
Total Working Age Population:
Total Households:
Total Working Age Population:
Total Households:
Total Working Age Population:
Total Households: