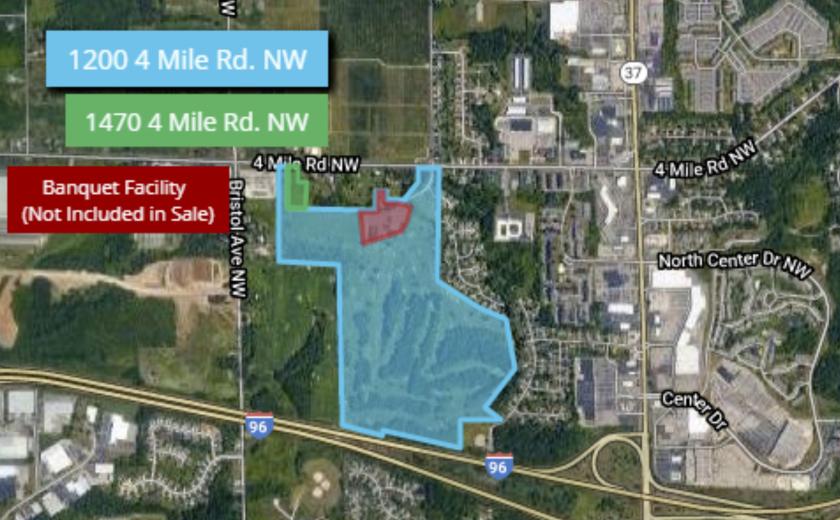
1-Mile | 3-Miles | 5-Miles | ||
---|---|---|---|---|
Total Population | 5,144 | 49,032 | 142,371 | |
Population Median Age | 38 | 37 | 37 | |
Population by Age | 0-9 Yrs | 614 (11%) | 6608 (13%) | 16585 (11%) |
10-19 Yrs | 394 (7%) | 5370 (10%) | 14987 (10%) | |
20-29 Yrs | 1170 (22%) | 8739 (17%) | 29160 (20%) | |
30-39 Yrs | 919 (17%) | 7477 (15%) | 21801 (15%) | |
40-49 Yrs | 462 (8%) | 5221 (10%) | 15378 (10%) | |
50-59 Yrs | 567 (11%) | 5676 (11%) | 16951 (11%) | |
60-69 Yrs | 394 (7%) | 5053 (10%) | 14521 (10%) | |
70+ Yrs | 624 (12%) | 4888 (9%) | 12989 (9%) | |
Median HH Income | $44,389 | $55,700 | $55,256 | |
Total Household Income | < 24K | 414 (18%) | 3415 (17%) | 12320 (21%) |
25-49K | 829 (36%) | 5363 (27%) | 14513 (24%) | |
50-74K | 335 (14%) | 3901 (20%) | 11696 (19%) | |
75-99K | 355 (15%) | 2764 (14%) | 8074 (13%) | |
100-199K | 266 (11%) | 3370 (17%) | 10285 (17%) | |
200K+ | 48 (2%) | 478 (2%) | 1743 (2%) | |
Highest Education Level | No Diploma | 313 | 2758 | 7859 |
Diploma or GED | 1053 | 8864 | 23335 | |
Some College | 1080 | 8543 | 22728 | |
Assoc. Degree | 303 | 3056 | 9323 | |
Bachelors Degree | 665 | 7212 | 24359 | |
Higher Degree | 195 | 2725 | 10074 | |
Total Housing Units | 2,301 | 20,593 | 63,255 | |
--Owner-Occupied | 877 | 12,140 | 34,801 | |
--Renter-Occupied | 1,370 | 7,150 | 23,829 | |
Owner-Occupied Values | < 100K | 82 | 2233 | 5955 |
100-199K | 540 | 7266 | 20016 | |
200-299K | 204 | 1959 | 6329 | |
300-399K | 47 | 546 | 1678 | |
400-499K | 2 | 63 | 328 | |
500K+ | 3 | 73 | 496 | |
Total Working Age Population | 4,294 | 39,097 | 116,458 | |
In Work Force | 3,110 | 27,096 | 82,011 | |
Not In Work Force | 1,184 | 12,001 | 34,447 | |
Workforce Employed | 3,021 | 26,118 | 78,421 | |
Workforce Unemployed | 89 | 932 | 3,495 | |
Civlian Workforce | 3,110 | 27,051 | 81,916 | |
Military Workforce | 0 | 45 | 95 | |
Total Households | 2,247 | 19,291 | 58,630 | |
Family Households | 1,259 | 11,676 | 32,102 | |
Non-Family Households | 989 | 7,614 | 26,528 | |
Married Couple | 817 | 8,460 | 23,196 | |
Other Family | 441 | 3,216 | 8,906 | |
Married w/Child | 210 | 3,261 | 8,595 | |
Single Male w/Child | 123 | 481 | 1,383 | |
Single Female w/Child | 132 | 1,475 | 3,705 |
Population Change Last Two Decades - Plus Projection
2000 | % | 2010 | % | 2020 | % | 2030 | |
---|---|---|---|---|---|---|---|
Michigan | 9,938,444 | -1 | 9,883,640 | +1 | 10,023,423 | +4 | 10,424,510 |
Kent County | 574,335 | +5 | 602,622 | +11 | 668,535 | +12 | 746,921 |
Ottawa County | 238,314 | +11 | 263,801 | +12 | 295,791 | +12 | 331,723 |
Total Working Age Population:
Total Households:
Total Working Age Population:
Total Households:
Total Working Age Population:
Total Households: