Industrial Properties
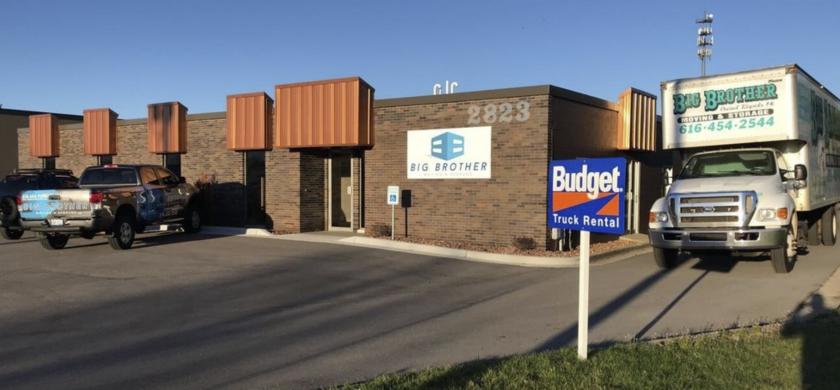
2823 Clydon Avenue Southwest Wyoming, MI 49519
2823 Clydon Avenue Southwest Wyoming, MI 49519
Details & Description
Property Highlights
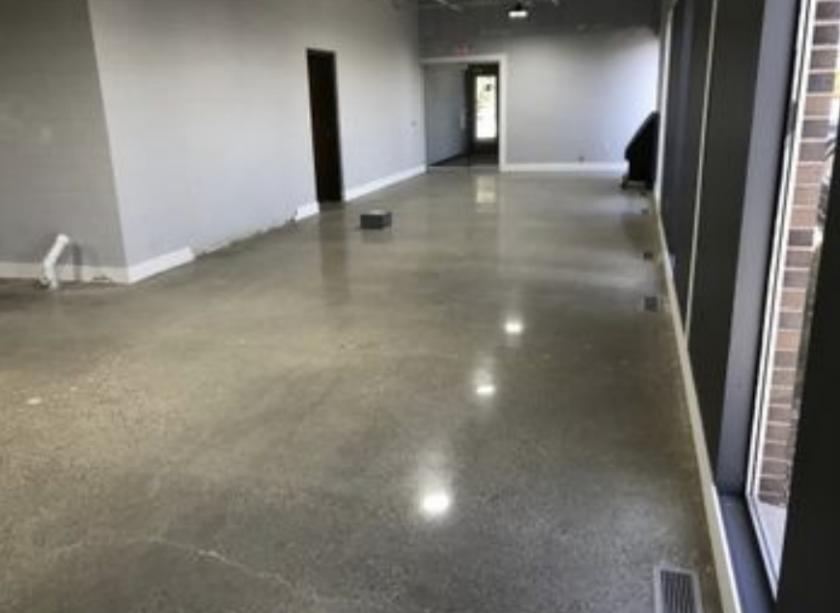
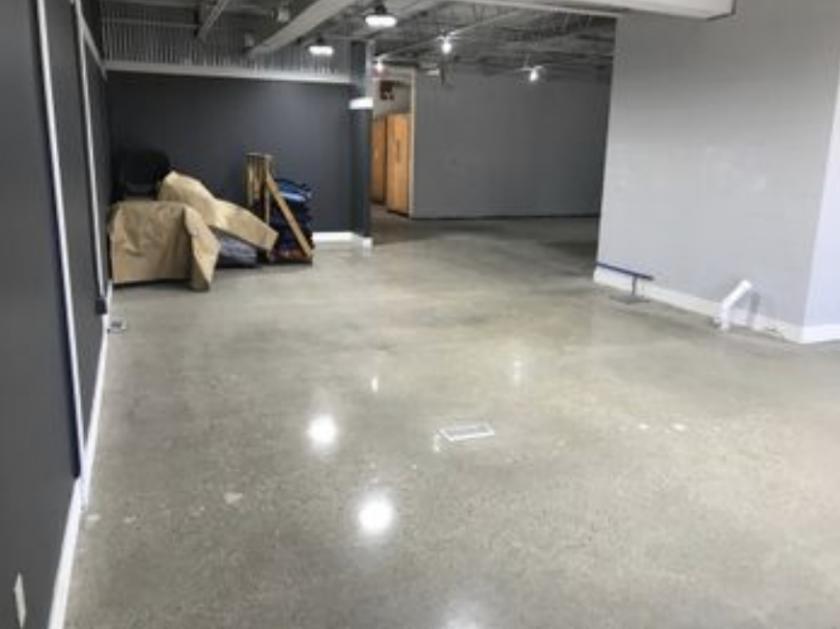
- • Recently renovated
- • Ample parking
- • 12 ceilings
- • 240V x 400 amps
- • Easy access to US-131, and I-196
- • Great fit for service companies
Listing Agents

Kevin VanHaitsma
O: 616-254-0038
M: 616-308-1727
kvanhaitsma@bradleyco.com
O: 616-254-0038
M: 616-308-1727
kvanhaitsma@bradleyco.com

Vee Kimbrell
Bradley Company
O: 574-213-5585
vkimbrell@bradleyco.com
Bradley Company
O: 574-213-5585
vkimbrell@bradleyco.com
While we strive to provide the most accurate information, all listing information, and demographic data, is provided by third-parties. As such, MyEListing will not be responsible for the accuracy of the information. It is strongly recommended that you verify all information with the listing agent, and any relevant agencies, prior to making any decisions.