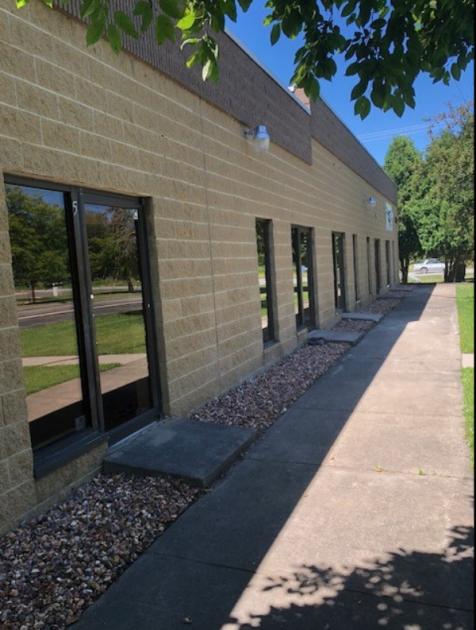
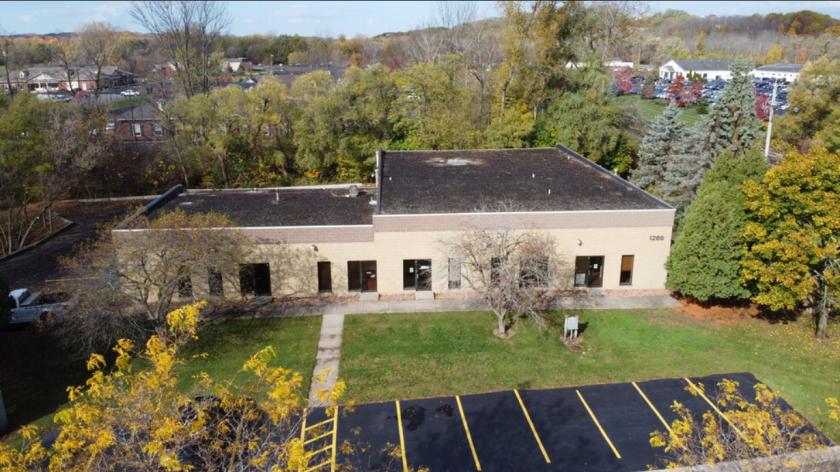
1-Mile | 3-Miles | 5-Miles | ||
---|---|---|---|---|
Total Population | 2,050 | 17,035 | 29,810 | |
Population Median Age | 39 | 39 | 40 | |
Population by Age | 0-9 Yrs | 347 (16%) | 2158 (12%) | 3661 (12%) |
10-19 Yrs | 129 (6%) | 2337 (13%) | 3972 (13%) | |
20-29 Yrs | 189 (9%) | 1820 (10%) | 3021 (10%) | |
30-39 Yrs | 382 (18%) | 2358 (13%) | 3844 (12%) | |
40-49 Yrs | 277 (13%) | 2562 (15%) | 4447 (14%) | |
50-59 Yrs | 316 (15%) | 2182 (12%) | 4109 (13%) | |
60-69 Yrs | 211 (10%) | 1798 (10%) | 3418 (11%) | |
70+ Yrs | 199 (9%) | 1821 (10%) | 3337 (11%) | |
Median HH Income | $73,929 | $78,596 | $82,631 | |
Total Household Income | < 24K | 48 (5%) | 759 (10%) | 1291 (10%) |
25-49K | 191 (20%) | 1281 (18%) | 2191 (18%) | |
50-74K | 243 (25%) | 1286 (18%) | 2023 (16%) | |
75-99K | 101 (10%) | 934 (13%) | 1703 (14%) | |
100-199K | 299 (31%) | 2019 (29%) | 3535 (29%) | |
200K+ | 59 (6%) | 642 (9%) | 1306 (10%) | |
Highest Education Level | No Diploma | 26 | 440 | 770 |
Diploma or GED | 192 | 1963 | 3725 | |
Some College | 229 | 1981 | 3303 | |
Assoc. Degree | 162 | 1295 | 2522 | |
Bachelors Degree | 476 | 3124 | 5339 | |
Higher Degree | 432 | 2805 | 4981 | |
Total Housing Units | 958 | 7,126 | 12,632 | |
--Owner-Occupied | 728 | 4,974 | 9,052 | |
--Renter-Occupied | 214 | 1,946 | 2,997 | |
Owner-Occupied Values | < 100K | 154 | 721 | 1176 |
100-199K | 348 | 1874 | 3252 | |
200-299K | 86 | 1052 | 1910 | |
300-399K | 93 | 848 | 1532 | |
400-499K | 27 | 258 | 651 | |
500K+ | 20 | 221 | 532 | |
Total Working Age Population | 1,618 | 13,182 | 23,315 | |
In Work Force | 1,200 | 9,223 | 16,120 | |
Not In Work Force | 417 | 3,959 | 7,195 | |
Workforce Employed | 1,187 | 8,998 | 15,718 | |
Workforce Unemployed | 13 | 226 | 400 | |
Civlian Workforce | 1,200 | 9,223 | 16,118 | |
Military Workforce | 0 | 0 | 2 | |
Total Households | 942 | 6,921 | 12,050 | |
Family Households | 465 | 4,530 | 8,066 | |
Non-Family Households | 478 | 2,391 | 3,984 | |
Married Couple | 423 | 3,564 | 6,532 | |
Other Family | 42 | 966 | 1,534 | |
Married w/Child | 200 | 1,613 | 2,857 | |
Single Male w/Child | 7 | 146 | 259 | |
Single Female w/Child | 18 | 499 | 727 |
Population Change Last Two Decades - Plus Projection
2000 | % | 2010 | % | 2020 | % | 2030 | |
---|---|---|---|---|---|---|---|
New York | 18,976,457 | +2 | 19,378,102 | +4 | 20,146,131 | +2 | 20,604,030 |
Monroe County | 735,343 | +1 | 744,344 | +1 | 754,529 | +1 | 758,536 |
Ontario County | 100,224 | +8 | 107,931 | +3 | 111,349 | +3 | 114,374 |
Wayne County | 93,765 | 0 | 93,772 | -4 | 89,564 | -3 | 86,754 |
Total Working Age Population:
Total Households:
Total Working Age Population:
Total Households:
Total Working Age Population:
Total Households: