Specialty Real Estate
111 North Chestnut Street Rochester, NY 14604
111 North Chestnut Street Rochester, NY 14604
Details & Description
Property Highlights
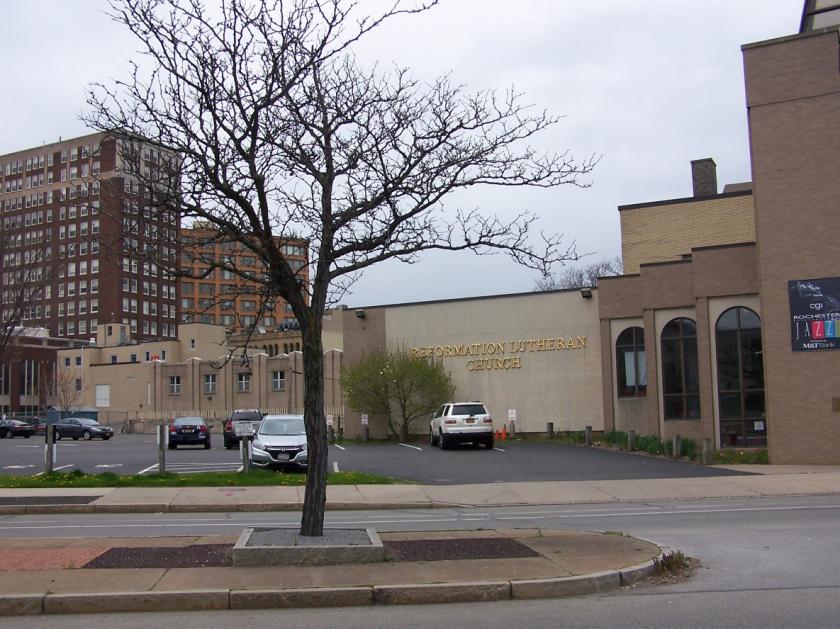
- • Near corner of Main and Chestnut
- • Heart of Rochesters redevelopment area
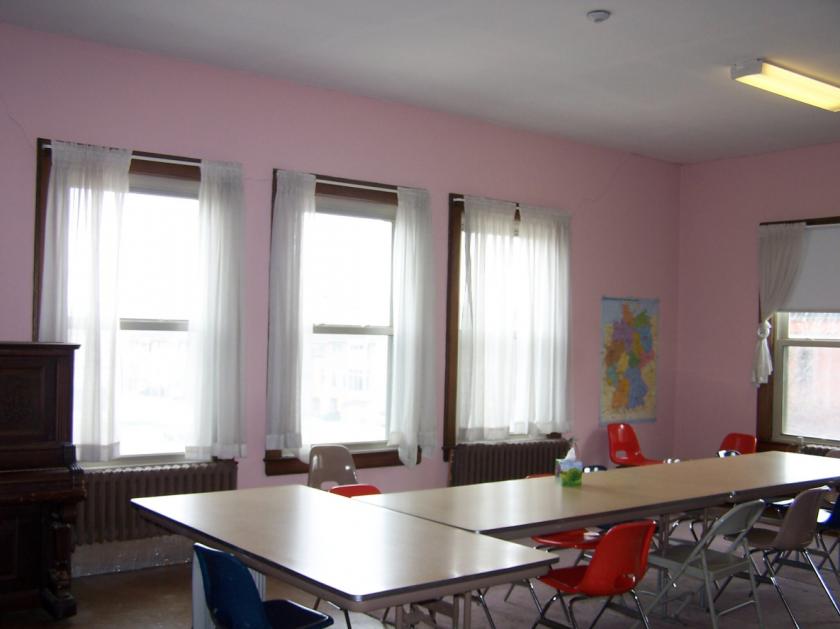
- • Well maintained
- • Great Visibility and access
- • Plenty of parking
- • great potential for additional revenue
Listing Agents

Michael Palumbo
O: 585-546-4866
mpalumbo@flaummgt.com
O: 585-546-4866
mpalumbo@flaummgt.com
While we strive to provide the most accurate information, all listing information, and demographic data, is provided by third-parties. As such, MyEListing will not be responsible for the accuracy of the information. It is strongly recommended that you verify all information with the listing agent, and any relevant agencies, prior to making any decisions.