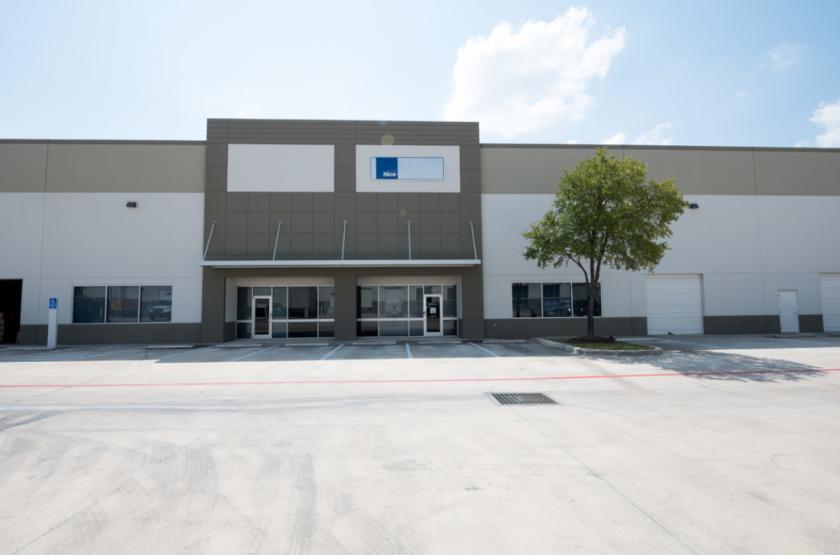
Flex-Office-Warehouse
12625 Wetmore Road San Antonio, TX 78247
12625 Wetmore Road San Antonio, TX 78247
Details & Description
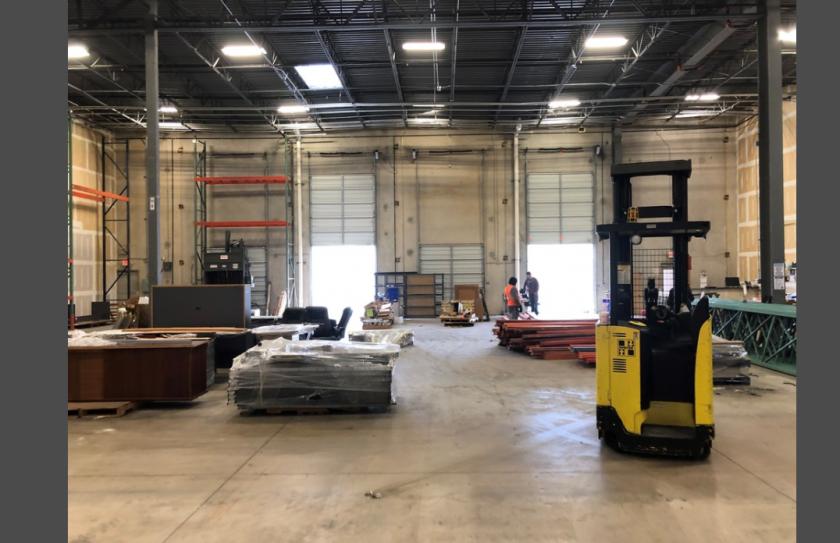
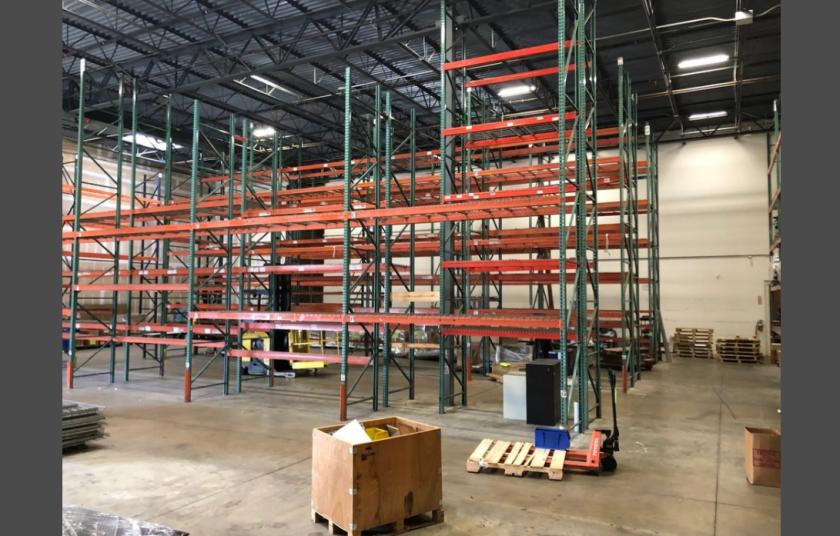
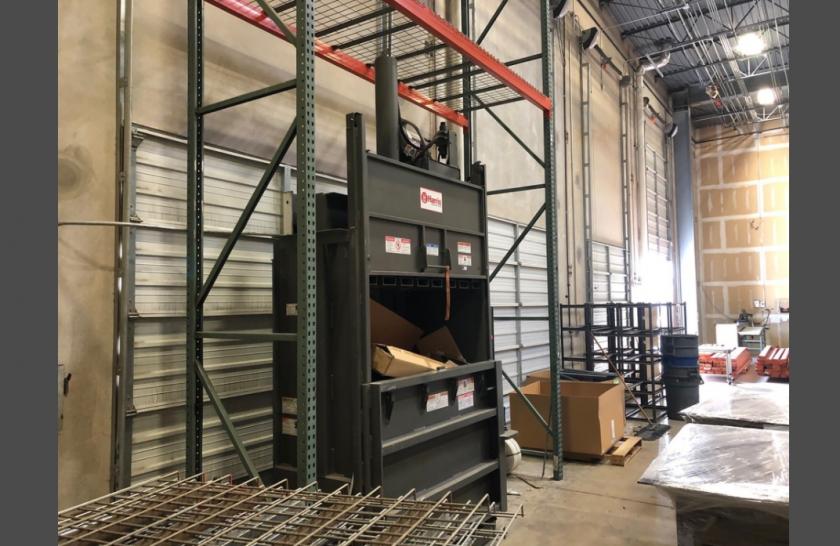
Additional Photos

Listing Agents

Carlos Marquez
O: 210-892-1413
carlos.marquez@partnersrealestate.com
O: 210-892-1413
carlos.marquez@partnersrealestate.com

Colten Courtney
O: 210-807-6552
colten.courtney@partnersrealestate.com
O: 210-807-6552
colten.courtney@partnersrealestate.com
While we strive to provide the most accurate information, all listing information, and demographic data, is provided by third-parties. As such, MyEListing will not be responsible for the accuracy of the information. It is strongly recommended that you verify all information with the listing agent, and any relevant agencies, prior to making any decisions.


