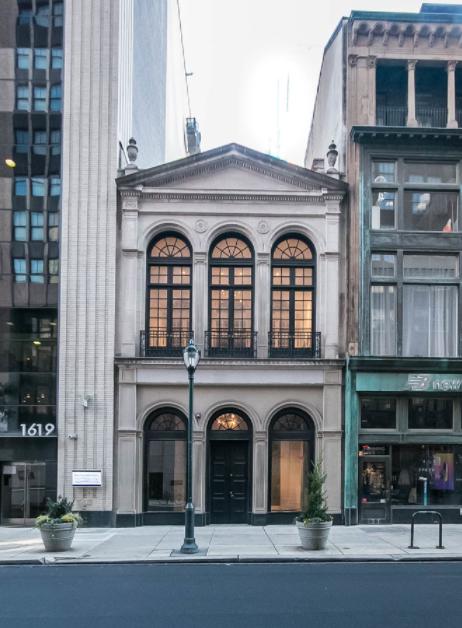
Retail Space
1617 Walnut Street Philadelphia, PA 19103
1617 Walnut Street Philadelphia, PA 19103
Details & Description
Property Highlights
- • First floor 2,614 SF
- • First floor mezz 773 SF
- • Second floor 2,770 SF
- • Second floor mezz 804 SF
- • Passenger elevator with 2,100 lb capacity
- • Zoned CMX-5
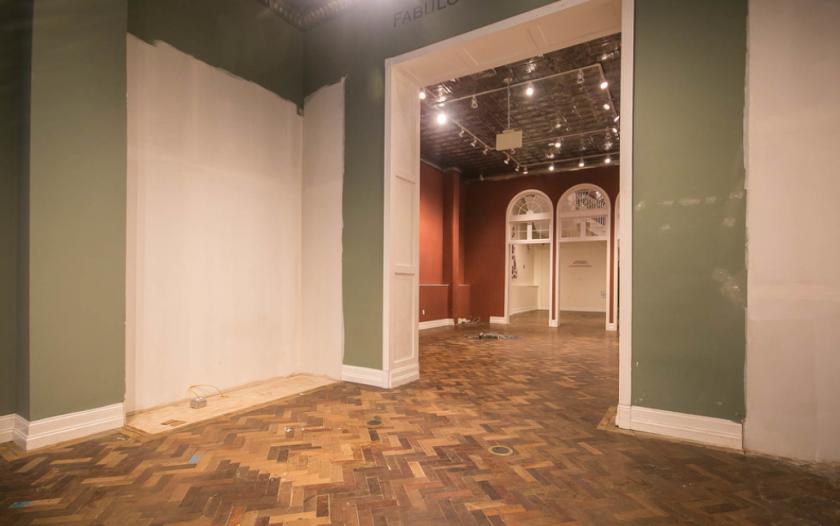
Additional Photos


Listing Agents

Veronica Blum
O: 267-238-1728
vblum@mpnrealty.com
O: 267-238-1728
vblum@mpnrealty.com
While we strive to provide the most accurate information, all listing information, and demographic data, is provided by third-parties. As such, MyEListing will not be responsible for the accuracy of the information. It is strongly recommended that you verify all information with the listing agent, and any relevant agencies, prior to making any decisions.


