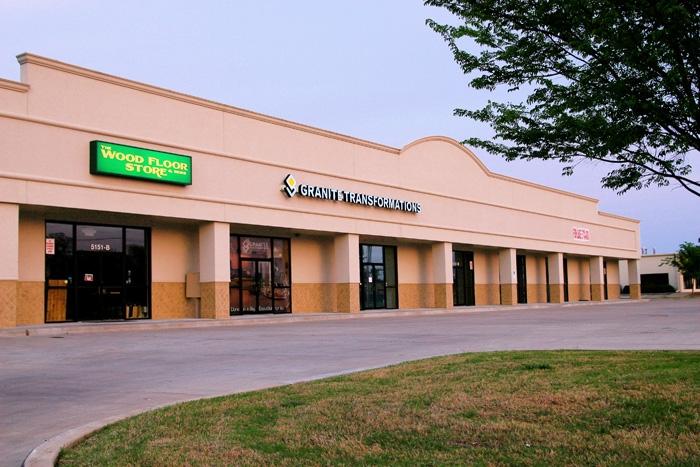
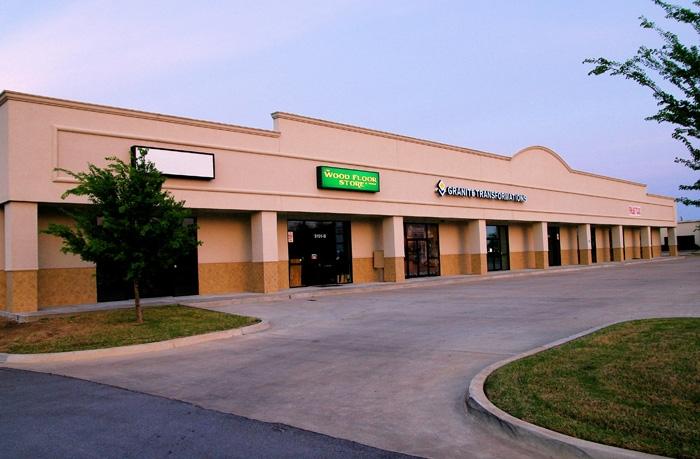
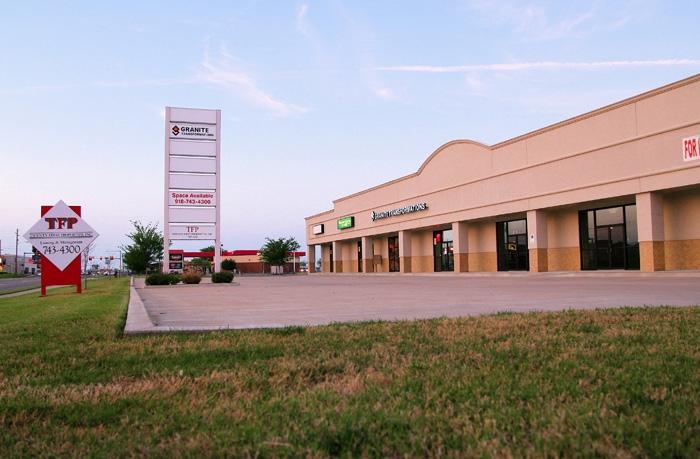
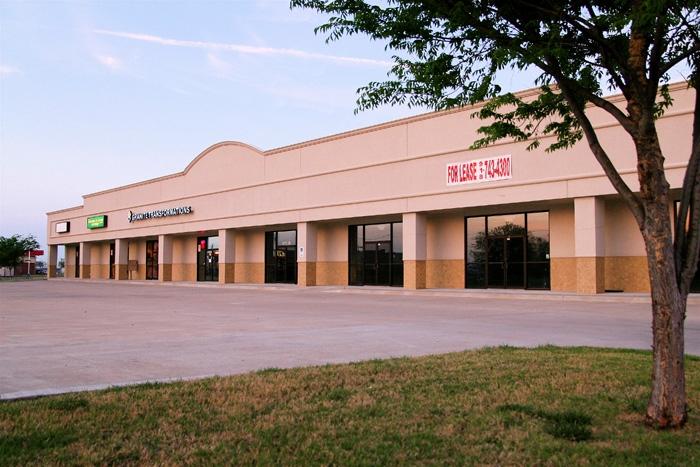
1-Mile | 3-Miles | 5-Miles | ||
---|---|---|---|---|
Total Population | 6,704 | 93,550 | 236,942 | |
Population Median Age | 35 | 36 | 37 | |
Population by Age | 0-9 Yrs | 917 (13%) | 13260 (14%) | 32054 (13%) |
10-19 Yrs | 956 (14%) | 12971 (13%) | 31356 (13%) | |
20-29 Yrs | 1207 (18%) | 15819 (16%) | 35697 (15%) | |
30-39 Yrs | 1054 (15%) | 12857 (13%) | 32141 (13%) | |
40-49 Yrs | 753 (11%) | 10691 (11%) | 28172 (11%) | |
50-59 Yrs | 766 (11%) | 10661 (11%) | 28541 (12%) | |
60-69 Yrs | 512 (7%) | 8628 (9%) | 25700 (10%) | |
70+ Yrs | 540 (8%) | 8664 (9%) | 23280 (9%) | |
Median HH Income | $44,676 | $48,371 | $55,525 | |
Total Household Income | < 24K | 767 (28%) | 8584 (23%) | 18751 (19%) |
25-49K | 693 (25%) | 10519 (28%) | 24364 (25%) | |
50-74K | 541 (20%) | 7121 (19%) | 18078 (19%) | |
75-99K | 201 (7%) | 4335 (11%) | 11454 (12%) | |
100-199K | 409 (15%) | 5474 (14%) | 17246 (18%) | |
200K+ | 79 (2%) | 1058 (2%) | 4978 (5%) | |
Highest Education Level | No Diploma | 569 | 7465 | 16071 |
Diploma or GED | 1327 | 16273 | 37662 | |
Some College | 1090 | 14771 | 37626 | |
Assoc. Degree | 328 | 4933 | 13556 | |
Bachelors Degree | 657 | 11587 | 35560 | |
Higher Degree | 344 | 4966 | 16801 | |
Total Housing Units | 2,974 | 41,290 | 105,236 | |
--Owner-Occupied | 996 | 16,201 | 51,471 | |
--Renter-Occupied | 1,696 | 20,890 | 43,400 | |
Owner-Occupied Values | < 100K | 276 | 2988 | 9624 |
100-199K | 595 | 10180 | 26317 | |
200-299K | 87 | 2298 | 9574 | |
300-399K | 17 | 393 | 3320 | |
400-499K | 6 | 174 | 1125 | |
500K+ | 15 | 169 | 1511 | |
Total Working Age Population | 5,157 | 72,276 | 185,172 | |
In Work Force | 3,843 | 49,644 | 126,675 | |
Not In Work Force | 1,315 | 22,632 | 58,496 | |
Workforce Employed | 3,582 | 46,652 | 119,773 | |
Workforce Unemployed | 259 | 2,927 | 6,756 | |
Civlian Workforce | 3,842 | 49,579 | 126,530 | |
Military Workforce | 1 | 65 | 146 | |
Total Households | 2,691 | 37,091 | 94,871 | |
Family Households | 1,496 | 22,139 | 57,925 | |
Non-Family Households | 1,195 | 14,952 | 36,947 | |
Married Couple | 872 | 14,147 | 40,886 | |
Other Family | 624 | 7,992 | 17,039 | |
Married w/Child | 463 | 5,804 | 16,431 | |
Single Male w/Child | 69 | 1,137 | 2,658 | |
Single Female w/Child | 249 | 3,507 | 6,975 |
Population Change Last Two Decades - Plus Projection
2000 | % | 2010 | % | 2020 | % | 2030 | |
---|---|---|---|---|---|---|---|
Oklahoma | 3,450,654 | +9 | 3,751,351 | +7 | 4,024,202 | +7 | 4,302,501 |
Rogers County | 70,641 | +23 | 86,905 | +14 | 98,672 | +14 | 112,208 |
Tulsa County | 563,299 | +7 | 603,403 | +8 | 652,183 | +8 | 703,461 |
Wagoner County | 57,491 | +27 | 73,085 | +14 | 83,139 | +14 | 94,385 |
Total Working Age Population:
Total Households:
Total Working Age Population:
Total Households:
Total Working Age Population:
Total Households: