Retail Space
3228 North Broad Street Philadelphia, PA 19140
3228 North Broad Street Philadelphia, PA 19140

Details & Description
Property Highlights
• Adjacent to campuses of Temple University Hospital and Shriners Childrens Hospital
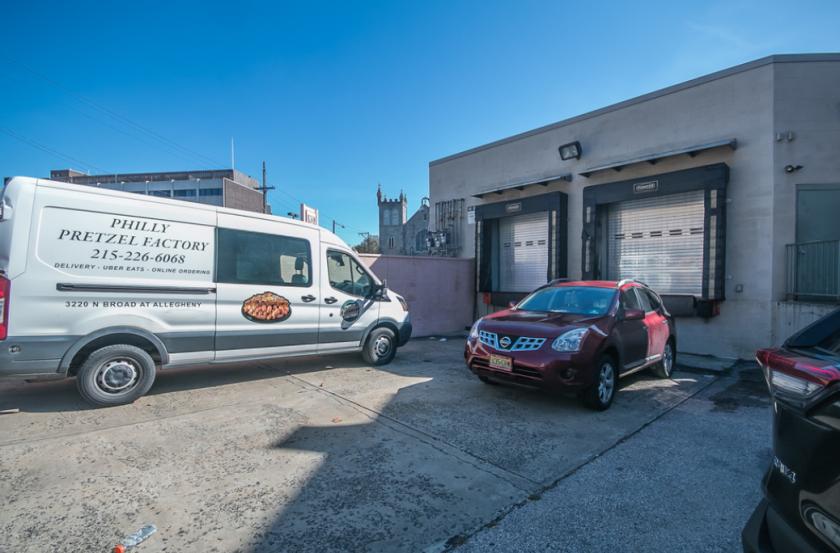
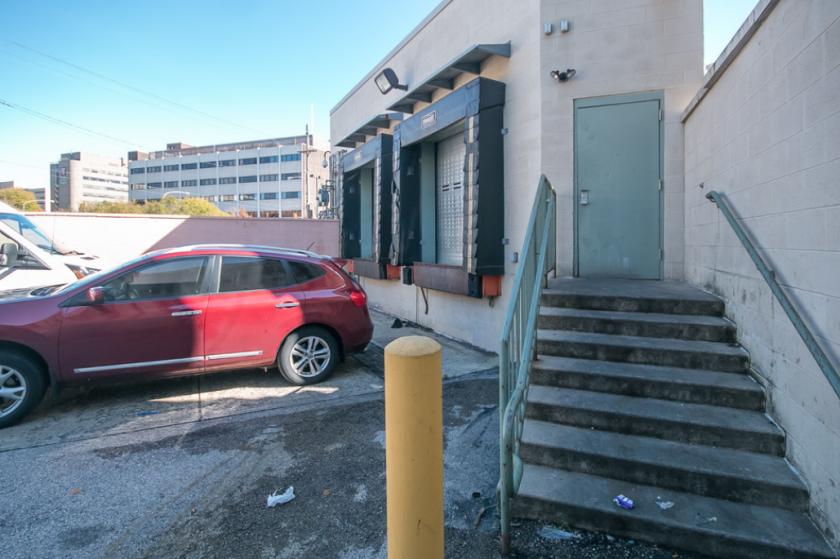
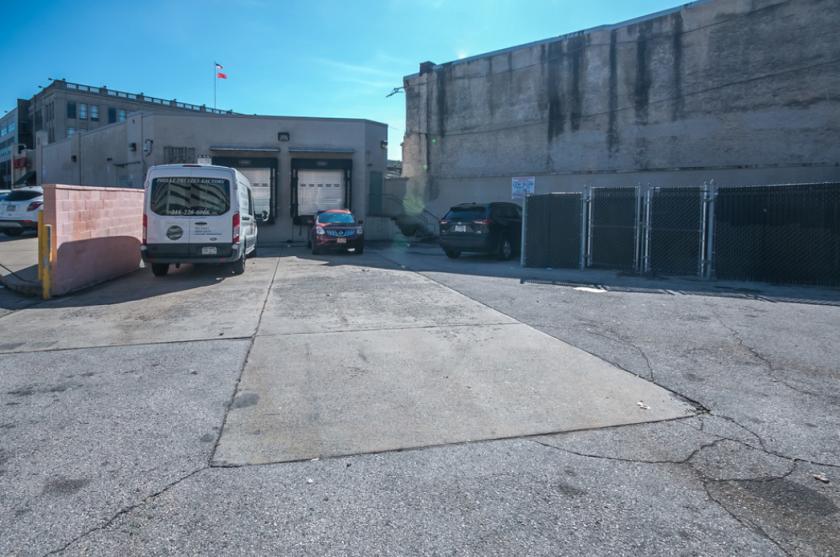
• 148 wide with easy access to trash and loading in rear
Additional Photos

Listing Agents

Veronica Blum
O: 267-238-1728
vblum@mpnrealty.com
O: 267-238-1728
vblum@mpnrealty.com
While we strive to provide the most accurate information, all listing information, and demographic data, is provided by third-parties. As such, MyEListing will not be responsible for the accuracy of the information. It is strongly recommended that you verify all information with the listing agent, and any relevant agencies, prior to making any decisions.


