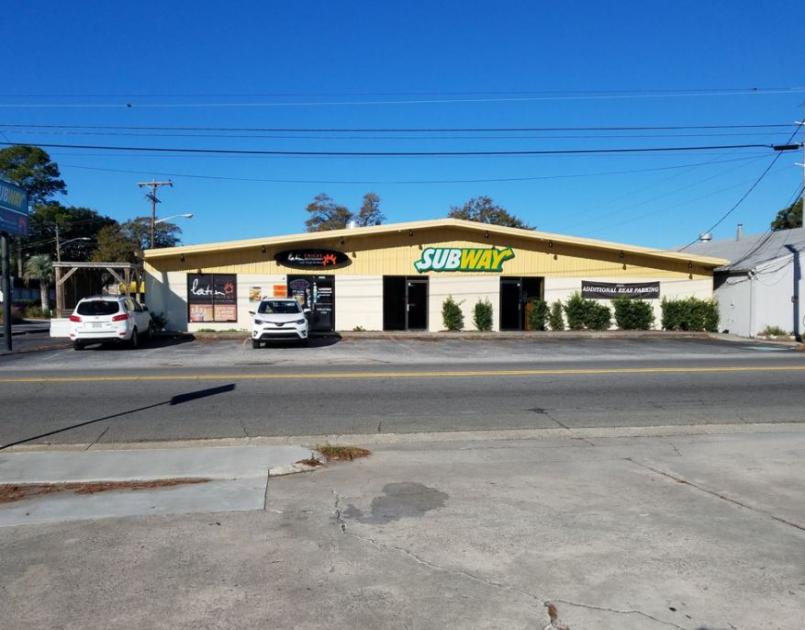
Retail Space
5205 Waters Avenue Savannah, GA 31404
5205 Waters Avenue Savannah, GA 31404
Details & Description
Property Highlights
- • Frontage on Waters Ave
- • Historically Low Vacancy
- • Newer Roof
- • Walking Distant from Memorial Hospital
- • Very Low Landlord Maintenance
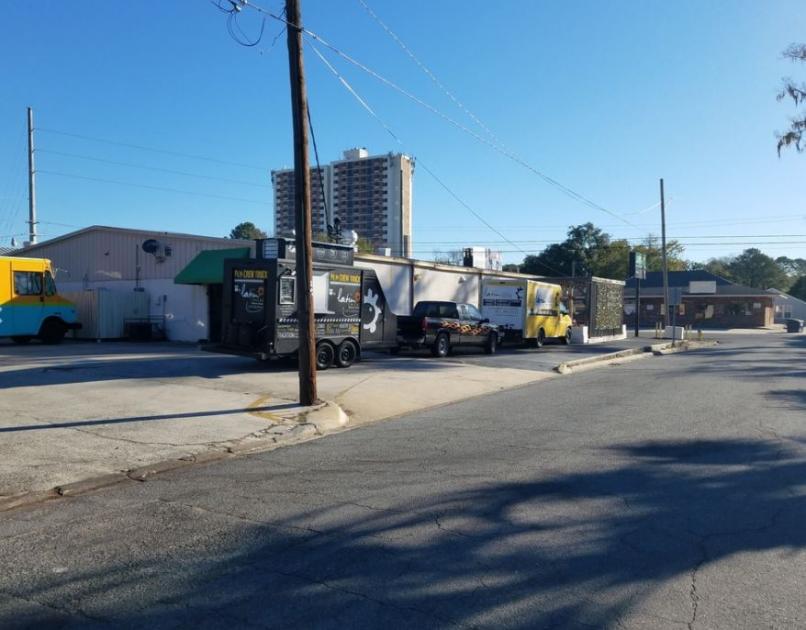
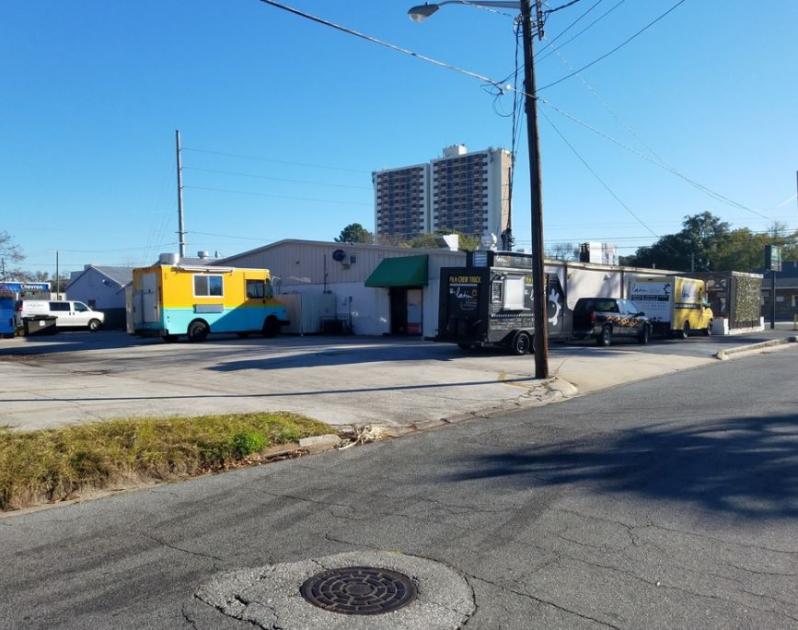
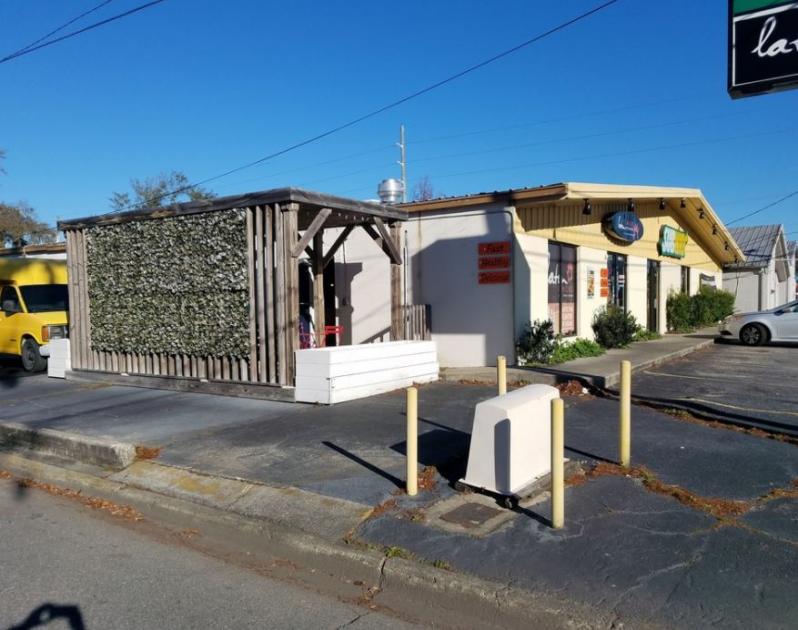
Additional Photos

Listing Agents

Joel Boblasky
O: 912-353-7707
joel@piercommercial.com
O: 912-353-7707
joel@piercommercial.com

Sharon Schneider
Pier CRE
O: 912-353-7707
sharon@piercommercial.com
Pier CRE
O: 912-353-7707
sharon@piercommercial.com
While we strive to provide the most accurate information, all listing information, and demographic data, is provided by third-parties. As such, MyEListing will not be responsible for the accuracy of the information. It is strongly recommended that you verify all information with the listing agent, and any relevant agencies, prior to making any decisions.


