Commercial Land
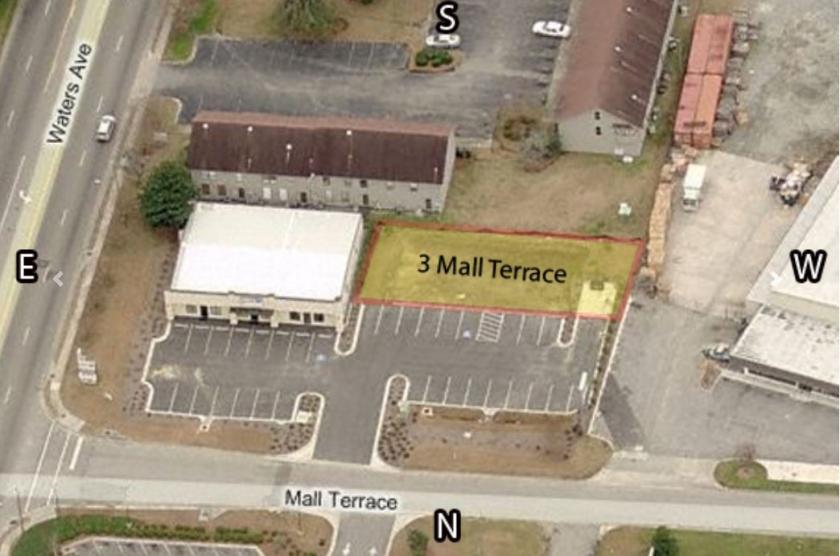
3 Mall Terrace Savannah, GA 31406
3 Mall Terrace Savannah, GA 31406
Details & Description
Property Highlights
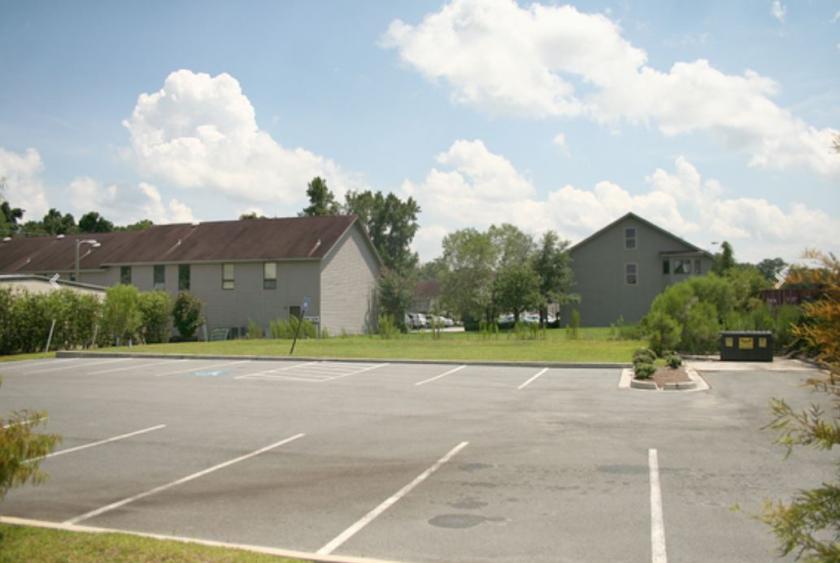
- • Pad Ready Site
- • Approx. 37 x73
- • Visibility from Waters Ave.
- • Parking lot built utilities stubbed
- • Signage on Water Avenue
Listing Agents

Joel Boblasky
O: 912-353-7707
joel@piercommercial.com
O: 912-353-7707
joel@piercommercial.com

Sharon Schneider
Pier CRE
O: 912-353-7707
sharon@piercommercial.com
Pier CRE
O: 912-353-7707
sharon@piercommercial.com
While we strive to provide the most accurate information, all listing information, and demographic data, is provided by third-parties. As such, MyEListing will not be responsible for the accuracy of the information. It is strongly recommended that you verify all information with the listing agent, and any relevant agencies, prior to making any decisions.