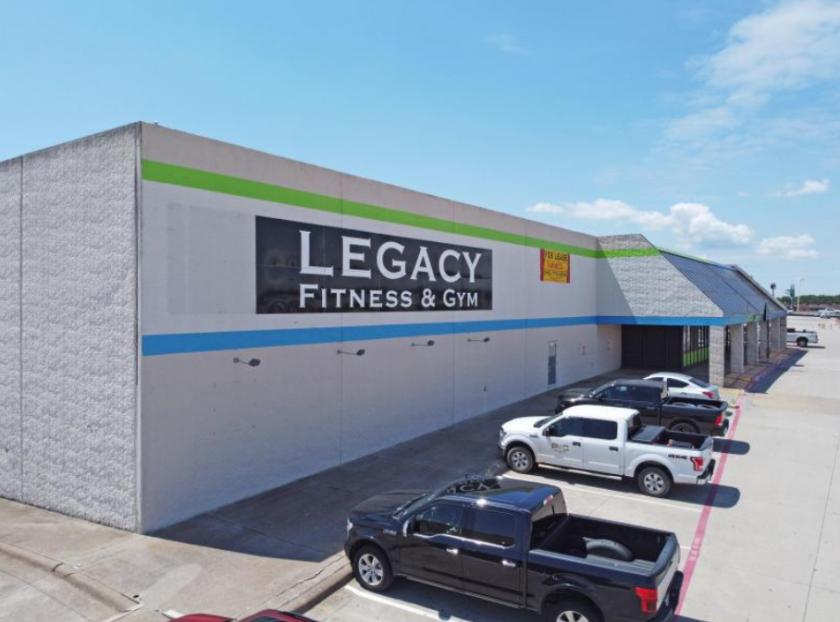
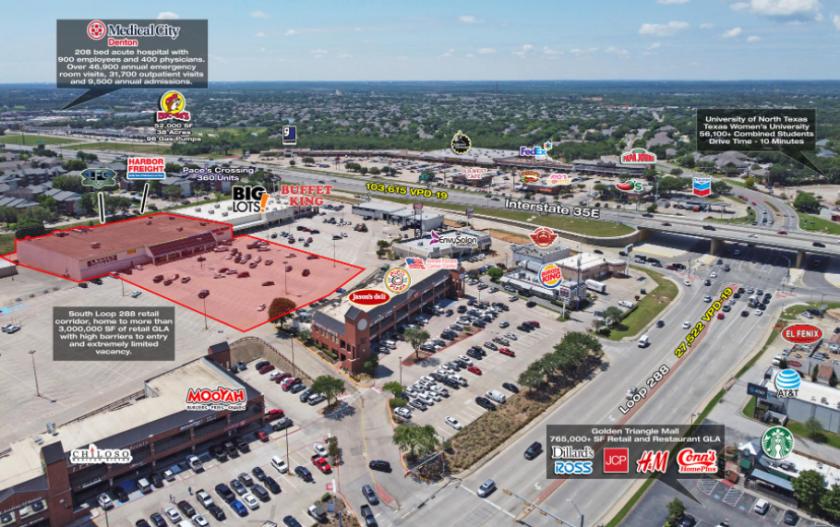
1-Mile | 3-Miles | 5-Miles | ||
---|---|---|---|---|
Total Population | 10,015 | 80,069 | 152,287 | |
Population Median Age | 37 | 33 | 35 | |
Population by Age | 0-9 Yrs | 902 (9%) | 9094 (11%) | 17042 (11%) |
10-19 Yrs | 1112 (11%) | 11194 (13%) | 22356 (14%) | |
20-29 Yrs | 2869 (28%) | 21240 (26%) | 35427 (23%) | |
30-39 Yrs | 1180 (11%) | 10755 (13%) | 20010 (13%) | |
40-49 Yrs | 907 (9%) | 9203 (11%) | 18100 (11%) | |
50-59 Yrs | 1218 (12%) | 8497 (10%) | 17203 (11%) | |
60-69 Yrs | 972 (9%) | 5493 (6%) | 11893 (7%) | |
70+ Yrs | 855 (8%) | 4593 (5%) | 10256 (6%) | |
Median HH Income | $63,005 | $60,999 | $65,391 | |
Total Household Income | < 24K | 773 (20%) | 5271 (19%) | 9367 (18%) |
25-49K | 851 (22%) | 6010 (22%) | 10445 (20%) | |
50-74K | 586 (15%) | 4686 (17%) | 9002 (17%) | |
75-99K | 475 (12%) | 3683 (13%) | 6966 (13%) | |
100-199K | 915 (23%) | 5853 (21%) | 12374 (24%) | |
200K+ | 219 (5%) | 1537 (5%) | 3390 (6%) | |
Highest Education Level | No Diploma | 391 | 4874 | 8873 |
Diploma or GED | 1126 | 8919 | 17101 | |
Some College | 1662 | 12452 | 23070 | |
Assoc. Degree | 448 | 3169 | 6984 | |
Bachelors Degree | 1418 | 11303 | 23512 | |
Higher Degree | 1178 | 6555 | 12821 | |
Total Housing Units | 4,157 | 29,593 | 56,269 | |
--Owner-Occupied | 1,702 | 12,788 | 27,676 | |
--Renter-Occupied | 2,117 | 14,252 | 23,867 | |
Owner-Occupied Values | < 100K | 5 | 1656 | 2940 |
100-199K | 261 | 3069 | 8171 | |
200-299K | 1060 | 4983 | 9993 | |
300-399K | 314 | 2250 | 4120 | |
400-499K | 18 | 515 | 1336 | |
500K+ | 44 | 315 | 1116 | |
Total Working Age Population | 8,414 | 66,220 | 125,944 | |
In Work Force | 5,645 | 45,449 | 86,818 | |
Not In Work Force | 2,769 | 20,771 | 39,126 | |
Workforce Employed | 5,355 | 43,066 | 82,488 | |
Workforce Unemployed | 290 | 2,351 | 4,290 | |
Civlian Workforce | 5,645 | 45,417 | 86,778 | |
Military Workforce | 0 | 32 | 40 | |
Total Households | 3,819 | 27,040 | 51,544 | |
Family Households | 2,213 | 15,681 | 31,529 | |
Non-Family Households | 1,606 | 11,358 | 20,015 | |
Married Couple | 1,571 | 11,571 | 24,214 | |
Other Family | 642 | 4,111 | 7,315 | |
Married w/Child | 585 | 5,309 | 10,853 | |
Single Male w/Child | 100 | 472 | 930 | |
Single Female w/Child | 205 | 1,559 | 2,565 |
Population Change Last Two Decades - Plus Projection
2000 | % | 2010 | % | 2020 | % | 2030 | |
---|---|---|---|---|---|---|---|
Texas | 20,851,820 | +21 | 25,145,561 | +18 | 29,677,668 | +18 | 34,894,452 |
Denton County | 432,976 | +53 | 662,614 | +36 | 897,953 | +37 | 1,234,110 |
Total Working Age Population:
Total Households:
Total Working Age Population:
Total Households:
Total Working Age Population:
Total Households: