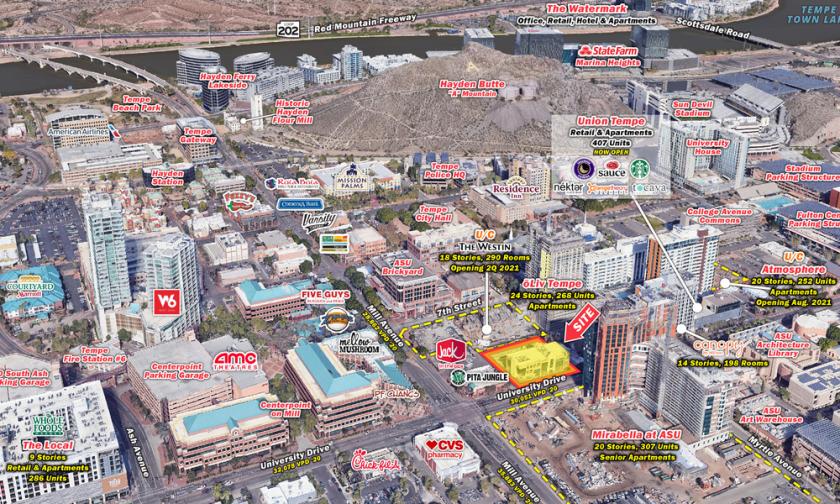
1-Mile | 3-Miles | 5-Miles | ||
---|---|---|---|---|
Total Population | 22,110 | 123,952 | 347,534 | |
Population Median Age | 26 | 32 | 35 | |
Population by Age | 0-9 Yrs | 469 (2%) | 9326 (7%) | 35996 (10%) |
10-19 Yrs | 7555 (34%) | 17679 (14%) | 42546 (12%) | |
20-29 Yrs | 9259 (41%) | 45563 (36%) | 93077 (26%) | |
30-39 Yrs | 1985 (8%) | 18385 (14%) | 54532 (15%) | |
40-49 Yrs | 882 (3%) | 9971 (8%) | 37289 (10%) | |
50-59 Yrs | 768 (3%) | 9377 (7%) | 34109 (9%) | |
60-69 Yrs | 718 (3%) | 7531 (6%) | 27107 (7%) | |
70+ Yrs | 475 (2%) | 6121 (4%) | 22878 (6%) | |
Median HH Income | $36,322 | $46,235 | $52,006 | |
Total Household Income | < 24K | 2356 (38%) | 13363 (27%) | 31212 (22%) |
25-49K | 1376 (22%) | 12192 (25%) | 35330 (25%) | |
50-74K | 832 (13%) | 8513 (17%) | 26559 (19%) | |
75-99K | 489 (8%) | 5249 (10%) | 16989 (12%) | |
100-199K | 760 (12%) | 7011 (14%) | 23136 (16%) | |
200K+ | 287 (4%) | 1500 (3%) | 4778 (3%) | |
Highest Education Level | No Diploma | 347 | 6818 | 25071 |
Diploma or GED | 779 | 11351 | 42974 | |
Some College | 1730 | 17119 | 55476 | |
Assoc. Degree | 438 | 5179 | 17475 | |
Bachelors Degree | 1851 | 17295 | 51303 | |
Higher Degree | 2045 | 12231 | 29661 | |
Total Housing Units | 7,134 | 54,310 | 154,042 | |
--Owner-Occupied | 1,163 | 14,004 | 52,308 | |
--Renter-Occupied | 4,937 | 33,824 | 85,695 | |
Owner-Occupied Values | < 100K | 42 | 2149 | 7937 |
100-199K | 234 | 3541 | 12817 | |
200-299K | 377 | 4793 | 16268 | |
300-399K | 164 | 2125 | 9343 | |
400-499K | 177 | 825 | 3153 | |
500K+ | 170 | 570 | 2789 | |
Total Working Age Population | 21,396 | 109,924 | 292,412 | |
In Work Force | 12,797 | 76,190 | 205,669 | |
Not In Work Force | 8,599 | 33,734 | 86,743 | |
Workforce Employed | 11,716 | 72,010 | 195,075 | |
Workforce Unemployed | 1,074 | 4,101 | 10,289 | |
Civlian Workforce | 12,790 | 76,111 | 205,363 | |
Military Workforce | 8 | 79 | 306 | |
Total Households | 6,100 | 47,828 | 138,003 | |
Family Households | 1,429 | 18,351 | 66,028 | |
Non-Family Households | 4,672 | 29,477 | 71,976 | |
Married Couple | 849 | 10,521 | 38,843 | |
Other Family | 580 | 7,830 | 27,185 | |
Married w/Child | 273 | 4,005 | 14,853 | |
Single Male w/Child | 49 | 1,093 | 3,651 | |
Single Female w/Child | 87 | 1,916 | 8,471 |
Population Change Last Two Decades - Plus Projection
2000 | % | 2010 | % | 2020 | % | 2030 | |
---|---|---|---|---|---|---|---|
Arizona | 5,130,632 | +25 | 6,392,017 | +14 | 7,286,100 | +14 | 8,284,900 |
Maricopa County | 3,072,149 | +24 | 3,817,117 | +16 | 4,436,900 | +15 | 5,107,700 |
Pinal County | 179,727 | +109 | 375,770 | +24 | 466,200 | +32 | 616,200 |
Total Working Age Population:
Total Households:
Total Working Age Population:
Total Households:
Total Working Age Population:
Total Households: