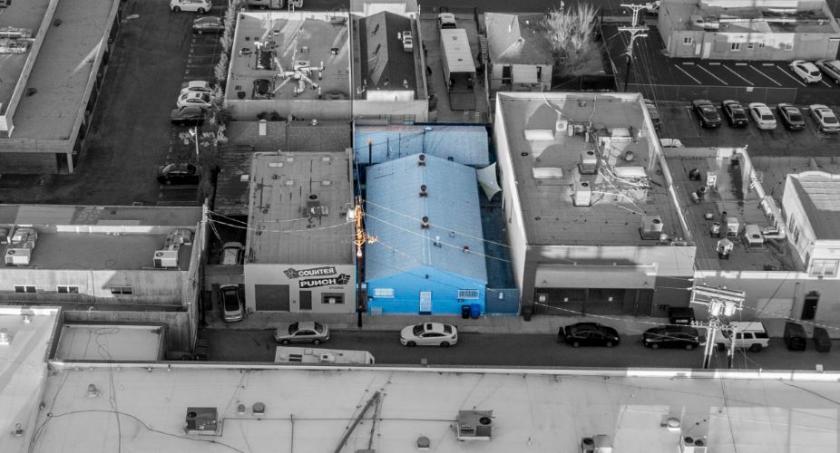
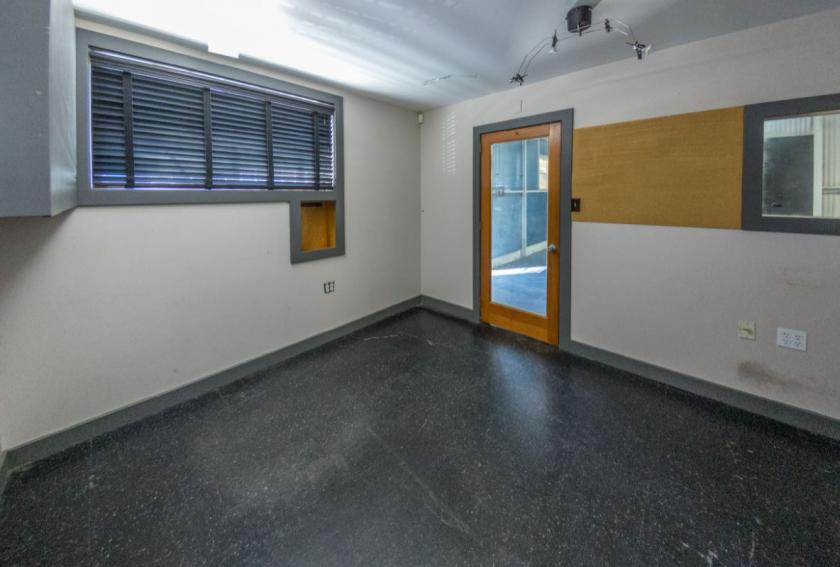
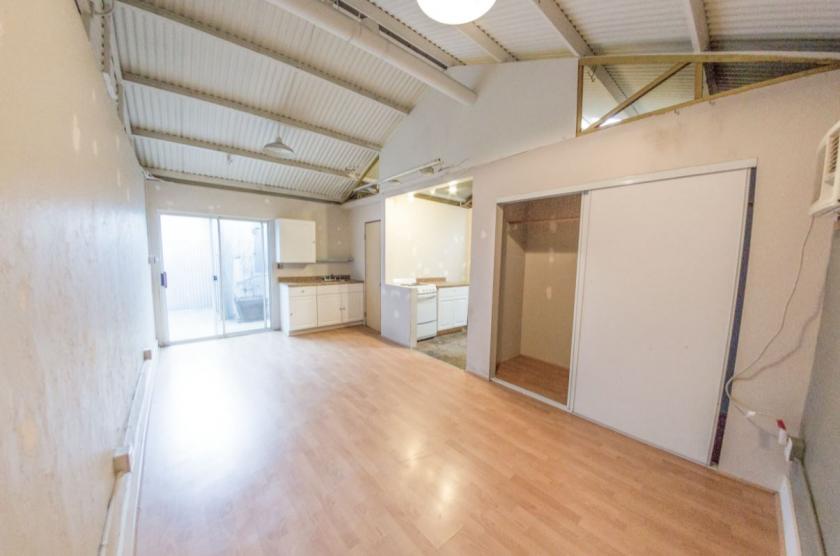
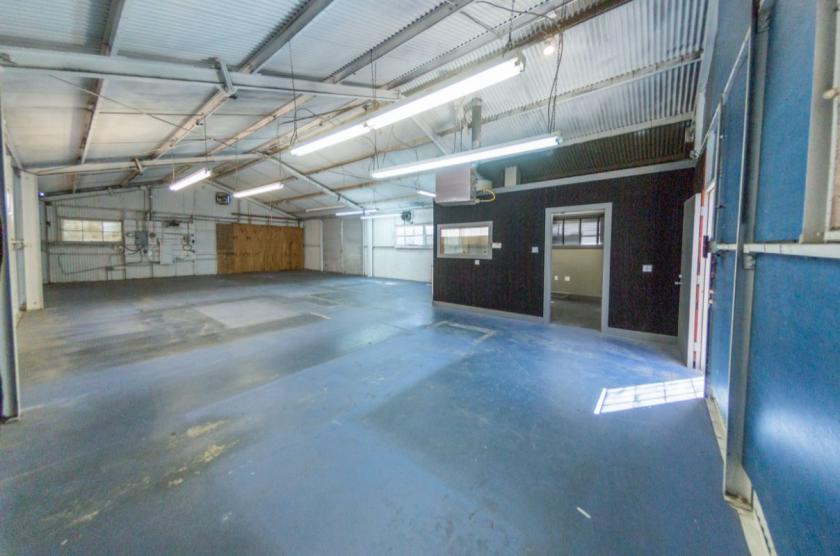
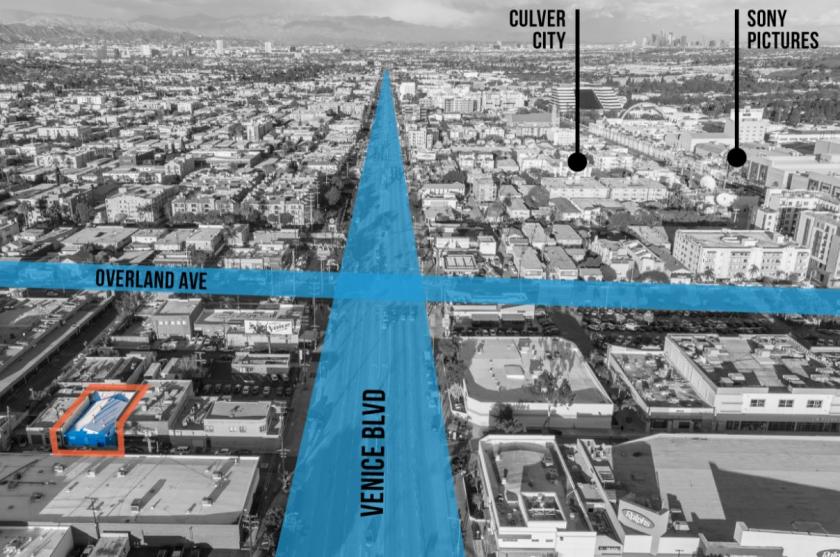
1-Mile | 3-Miles | 5-Miles | ||
---|---|---|---|---|
Total Population | 50,267 | 279,450 | 819,304 | |
Population Median Age | 37 | 39 | 39 | |
Population by Age | 0-9 Yrs | 3916 (7%) | 27699 (9%) | 74369 (9%) |
10-19 Yrs | 3093 (6%) | 23403 (8%) | 77772 (9%) | |
20-29 Yrs | 11476 (22%) | 46759 (16%) | 147446 (17%) | |
30-39 Yrs | 12124 (24%) | 51440 (18%) | 149617 (18%) | |
40-49 Yrs | 7407 (14%) | 41905 (14%) | 110441 (13%) | |
50-59 Yrs | 4903 (9%) | 32479 (11%) | 97910 (11%) | |
60-69 Yrs | 4008 (7%) | 27445 (9%) | 81243 (9%) | |
70+ Yrs | 3339 (6%) | 28321 (10%) | 80507 (9%) | |
Median HH Income | $78,276 | $87,002 | $83,289 | |
Total Household Income | < 24K | 3365 (13%) | 17531 (14%) | 61211 (16%) |
25-49K | 4100 (16%) | 18888 (15%) | 55014 (15%) | |
50-74K | 4113 (16%) | 16991 (13%) | 50072 (13%) | |
75-99K | 4137 (17%) | 15755 (12%) | 41905 (11%) | |
100-199K | 6284 (25%) | 32718 (26%) | 93352 (25%) | |
200K+ | 2241 (9%) | 20067 (16%) | 58832 (16%) | |
Highest Education Level | No Diploma | 2706 | 19485 | 53814 |
Diploma or GED | 4000 | 22228 | 69702 | |
Some College | 6961 | 35283 | 104096 | |
Assoc. Degree | 2057 | 10760 | 33837 | |
Bachelors Degree | 14289 | 70300 | 202309 | |
Higher Degree | 9938 | 54343 | 141054 | |
Total Housing Units | 26,462 | 131,851 | 397,943 | |
--Owner-Occupied | 4,660 | 47,790 | 123,092 | |
--Renter-Occupied | 19,579 | 74,158 | 237,295 | |
Owner-Occupied Values | < 100K | 90 | 664 | 1882 |
100-199K | 20 | 391 | 1167 | |
200-299K | 51 | 679 | 2440 | |
300-399K | 88 | 1565 | 4743 | |
400-499K | 148 | 2412 | 6919 | |
500K+ | 4263 | 42078 | 105941 | |
Total Working Age Population | 44,194 | 236,566 | 704,761 | |
In Work Force | 34,715 | 167,718 | 485,557 | |
Not In Work Force | 9,479 | 68,848 | 219,204 | |
Workforce Employed | 33,113 | 160,246 | 458,644 | |
Workforce Unemployed | 1,602 | 7,436 | 26,520 | |
Civlian Workforce | 34,715 | 167,682 | 485,163 | |
Military Workforce | 0 | 36 | 393 | |
Total Households | 24,240 | 121,949 | 360,387 | |
Family Households | 9,728 | 60,811 | 166,706 | |
Non-Family Households | 14,512 | 61,138 | 193,681 | |
Married Couple | 7,288 | 45,719 | 119,756 | |
Other Family | 2,440 | 15,091 | 46,951 | |
Married w/Child | 3,005 | 18,988 | 46,720 | |
Single Male w/Child | 207 | 1,551 | 5,512 | |
Single Female w/Child | 486 | 4,020 | 13,447 |
Population Change Last Two Decades - Plus Projection
2000 | % | 2010 | % | 2020 | % | 2030 | |
---|---|---|---|---|---|---|---|
California | 33,871,648 | +10 | 37,253,956 | +9 | 40,467,295 | +8 | 43,631,295 |
Los Angeles County | 9,519,338 | +3 | 9,818,605 | +6 | 10,369,367 | +4 | 10,759,850 |
Total Working Age Population:
Total Households:
Total Working Age Population:
Total Households:
Total Working Age Population:
Total Households: