Industrial Properties
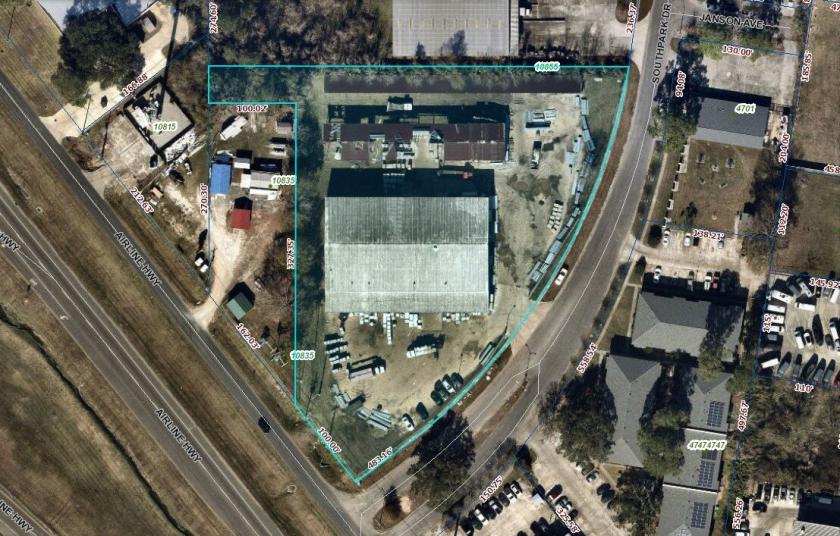
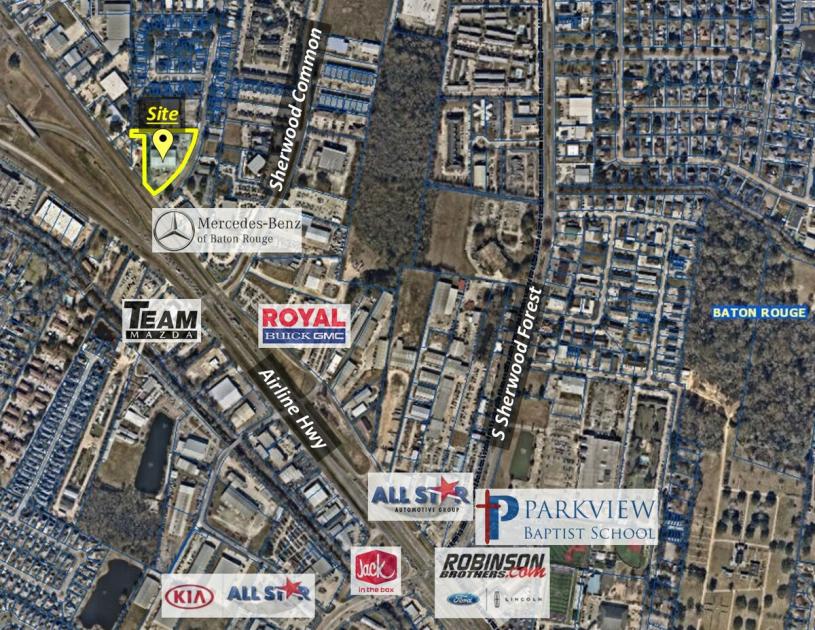
10855 Airline Highway Baton Rouge, LA 70816
10855 Airline Highway Baton Rouge, LA 70816
Details & Description
Listing Agents

Judah Vedros
O: 225-925-0600
judah@kurzhebert.com
O: 225-925-0600
judah@kurzhebert.com
While we strive to provide the most accurate information, all listing information, and demographic data, is provided by third-parties. As such, MyEListing will not be responsible for the accuracy of the information. It is strongly recommended that you verify all information with the listing agent, and any relevant agencies, prior to making any decisions.