Commercial Land
8649 Earhart Boulevard New Orleans, LA 70118
8649 Earhart Boulevard New Orleans, LA 70118
Details & Description
Property Highlights
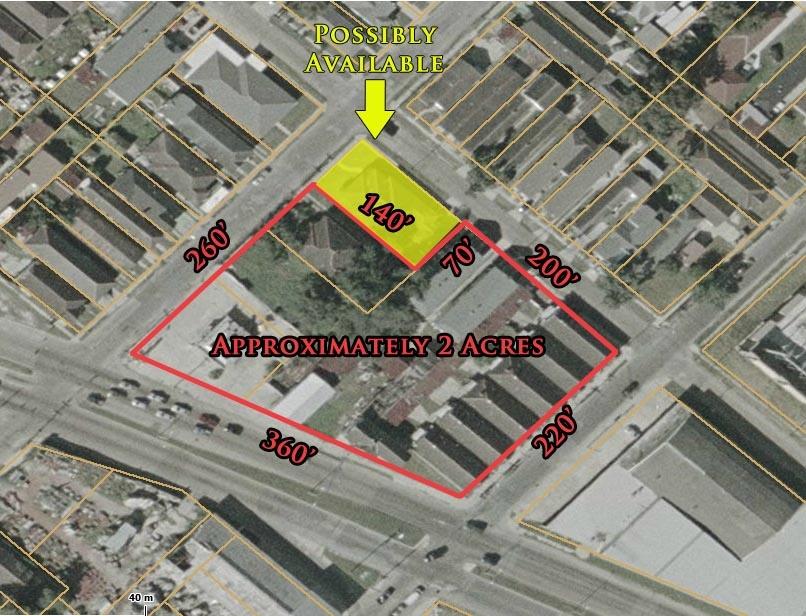
• The land has approximately 360 ft of frontage on Earhart Blvd. and makes up a total of 1.8 acres.
• Please see listing agent for price and additional details.
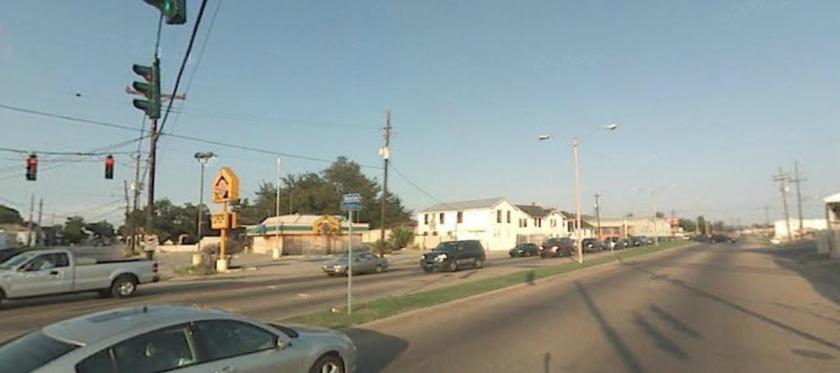
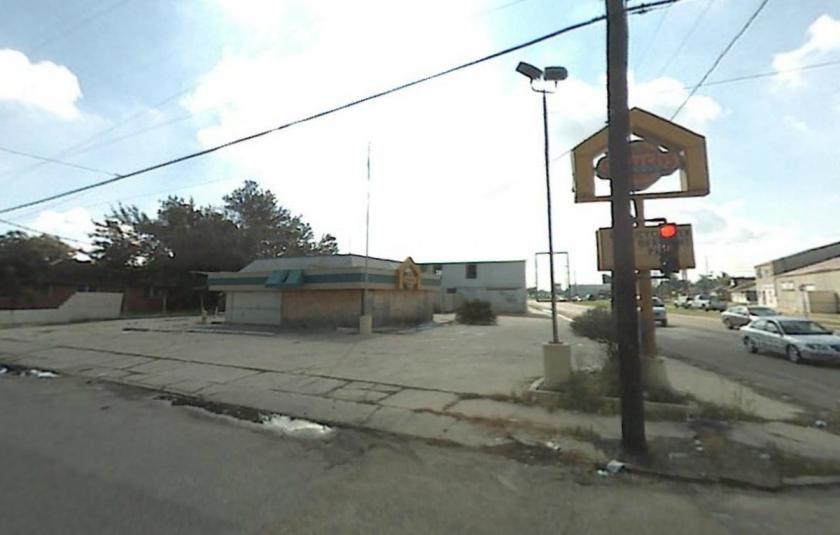
Additional Photos

Listing Agents

Mark Hebert
O: 225-925-0600
mark@kurzhebert.com
O: 225-925-0600
mark@kurzhebert.com
While we strive to provide the most accurate information, all listing information, and demographic data, is provided by third-parties. As such, MyEListing will not be responsible for the accuracy of the information. It is strongly recommended that you verify all information with the listing agent, and any relevant agencies, prior to making any decisions.


