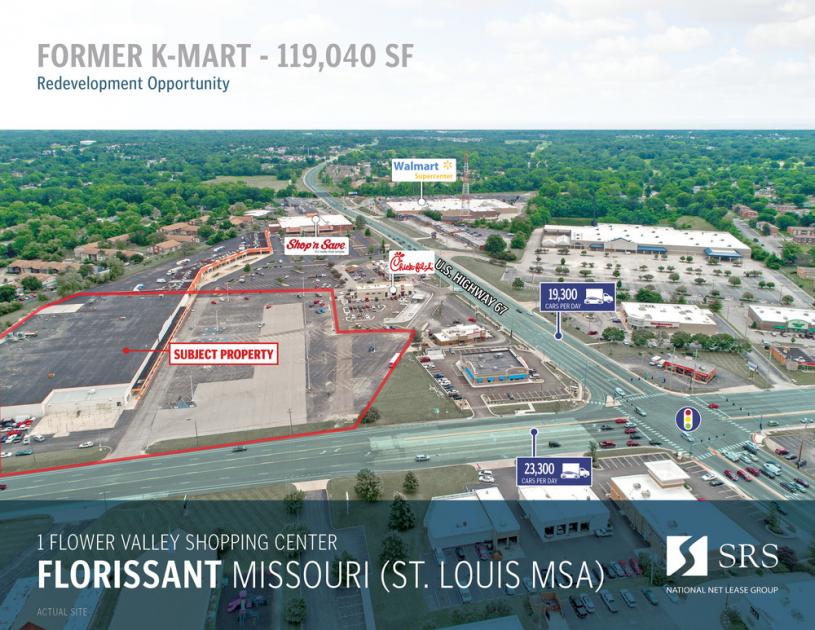
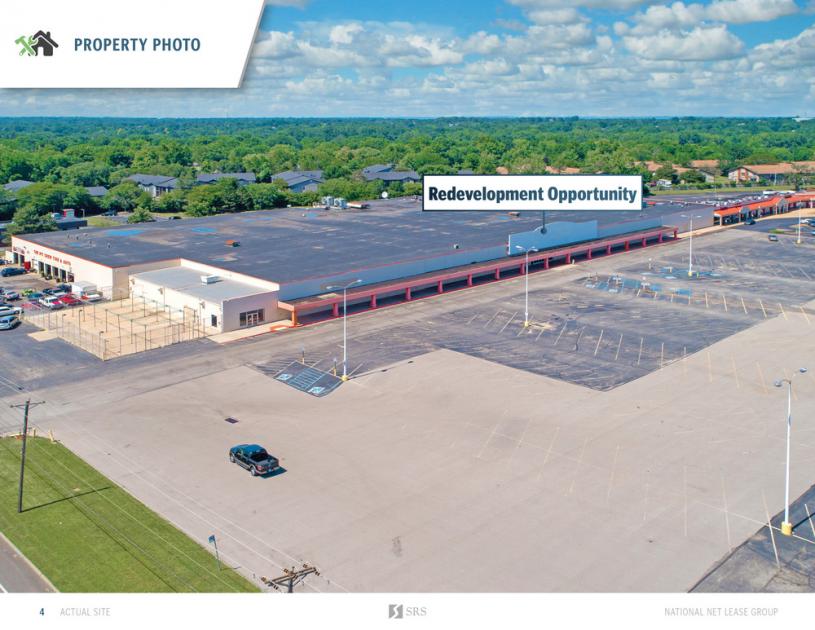
SRS National Net Lease Group is pleased to offer the opportunity to acquire the fee simple interest (land and building ownership) in a vacant 125,257 SF former K-Mart building with a single tenant currently occupied by The Pit Crew (4,300 SF), situated on a 10.99 acre parcel in Florissant, Missouri (St. Louis MSA). The site presents an excellent redevelopment opportunity as it is part of Shop N Save anchored shopping center. The property is zoned as Extensive Business District (B-3), providing for a wide range of uses and opportunities for a new owner.The offering is a freestanding, vacant, 125,257 SF, former K-Mart. Buyer will be responsible for any capital expenditures, demising costs, tenant improvements, leasing commissions, and all other re-tenanting costs. The property can be acquired with or without the single tenant Chick-fil-A (10-year term) outparcel priced at $1,684,000 (contact agent for details).The subject property is located near the signalized intersection of U.S. Highway 67 and New Halls Ferry Road with combined 42,600 vehicles passing by daily. The property is just across from a 325,000 square foot power center anchored by The Home Depot, Schnucks, Marshalls, and PetSmart. The asset is well positioned within a dense retail corridor with the nearby national/credit tenants including a Walmart Supercenter, Target, ALDI, Walgreens, Michaels, Five Below, and more, further increasing consumer draw to the trade area. Moreover, the site is under 4 miles from St. Louis Community College with 7,200 enrolled students. The 5-mile trade area is supported by a population of over 180,300 residents with an average household income of $67,900.