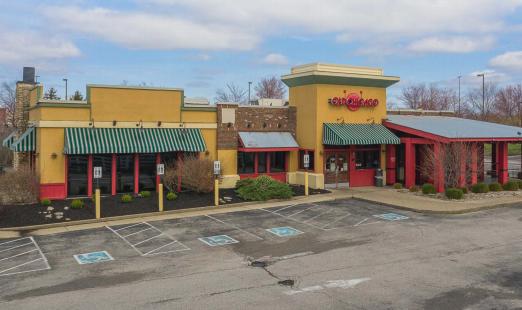
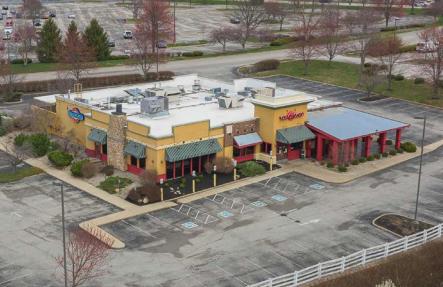
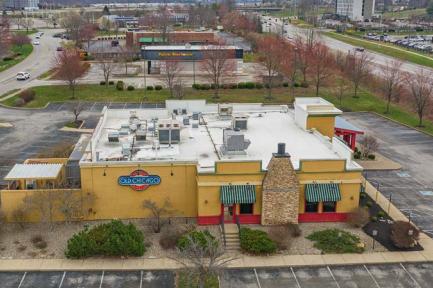
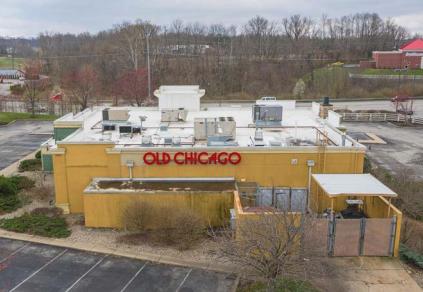
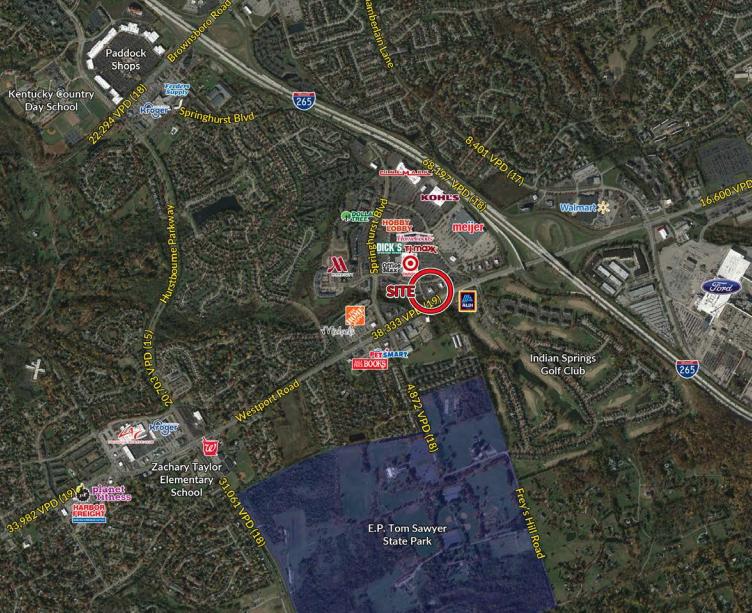
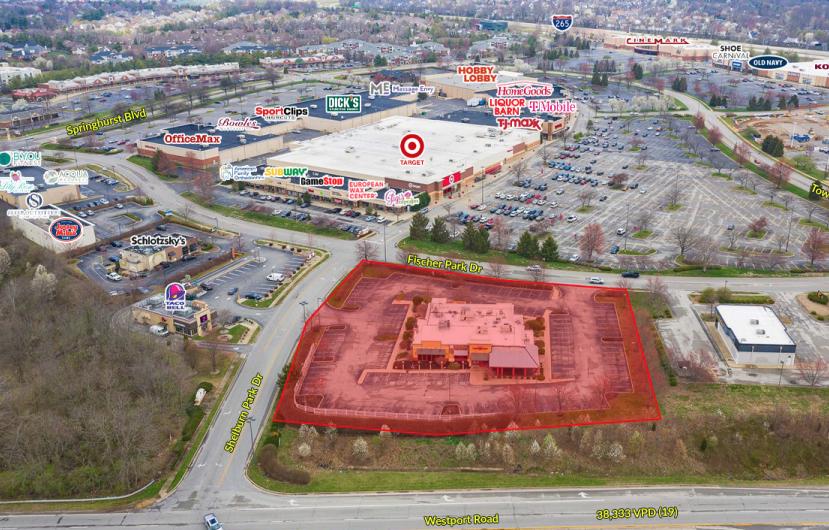
Available for sale or lease is a 7,148 SF ± free-standing building featuring a 993 SF ± patio.? It is located on a 1.81 ± acre site with over 240 feet of frontage on Westport Road.? This building is strategically located at the front of one of the main entrances to the Springhurst Towne Center.? The Springhurst Towne Center is one of the dominant shopping centers in the Louisville MSA, featuring a number of national retailers.?The site is located within the Springhurst area which features a very strong surrounding demographic makeup.? The Springhurst area is a vibrant trade area with a great mix of retail, office, industrial, and residential tenants.? The surrounding area is home to many big-box retail tenants including Target, Home Depot, Kohl's, Meijer, Walmart, Hobby Lobby, Dick's Sporting Goods, Kroger, and Cinemark Theaters.? There are also many junior-box retailers such as TJ Maxx, Aldi, HomeGoods, Office Max, Michaels, PetSmart, and Liquor Barn.?The Springhurst area is also home to a number of hotel tenants such as Residence Inn by Marriot, Towneplace Suites by Marriot, Fairfield Inn & Suites by Marriot, Courtyard by Marriot, Aloft Hotels, Holiday Inn Express, and Hampton Inn.The site offers great visibility to over 38,000 vehicles per day along Westport Road. There is very convenient access to Interstate 265, Interstate 71, and Hurstbourne Parkway. The site is located less than one mile from the Ford Kentucky Truck Plant with over 8,900 employees.