Retail Space
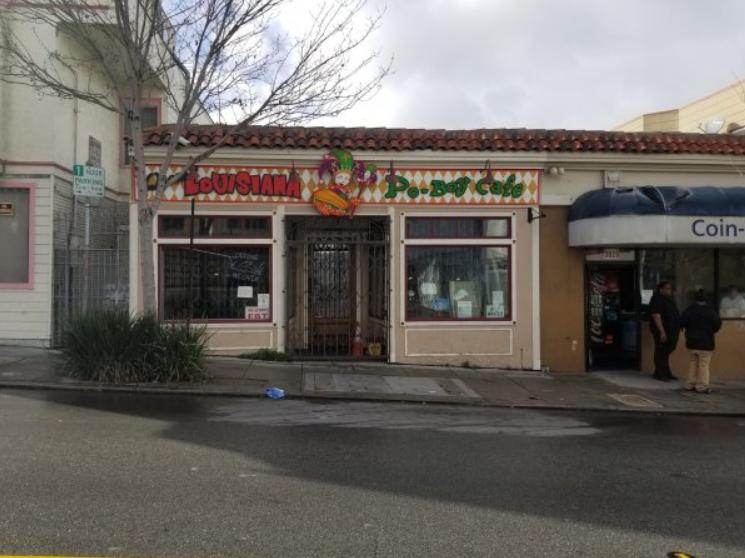
3030 San Bruno Avenue San Francisco, CA 94134
3030 San Bruno Avenue San Francisco, CA 94134
Details & Description
Property Highlights
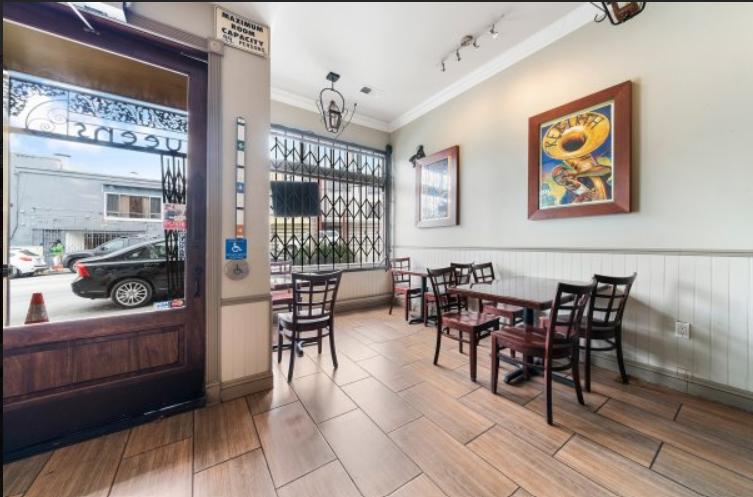
- • aprx. 1600 sq. ft of restaurant space
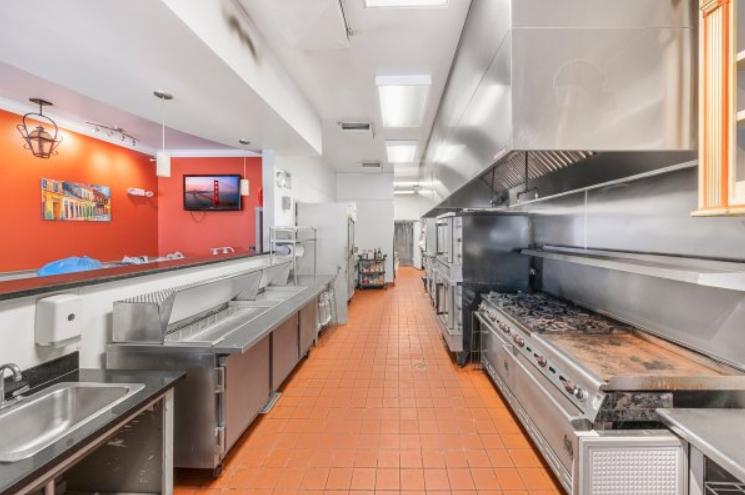
- • Captive Aire 20ft. Type 1 Hood
- • Walk-In Combo Cooler Freezer
- • Prep Kitchen with Prep Sink
- • Open Storage Stainless Steel Shelving
- • Waterline Drainage
Listing Agents

Priscilla Wilder
M: 510-367-5355
priscilla@starboardnet.com
M: 510-367-5355
priscilla@starboardnet.com
While we strive to provide the most accurate information, all listing information, and demographic data, is provided by third-parties. As such, MyEListing will not be responsible for the accuracy of the information. It is strongly recommended that you verify all information with the listing agent, and any relevant agencies, prior to making any decisions.