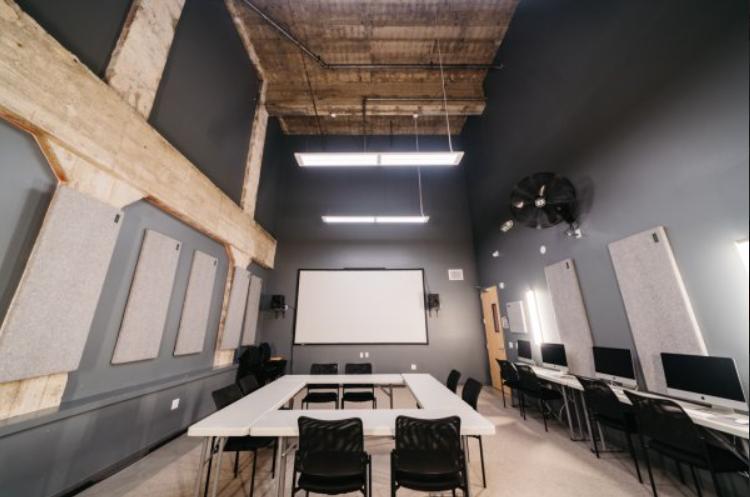
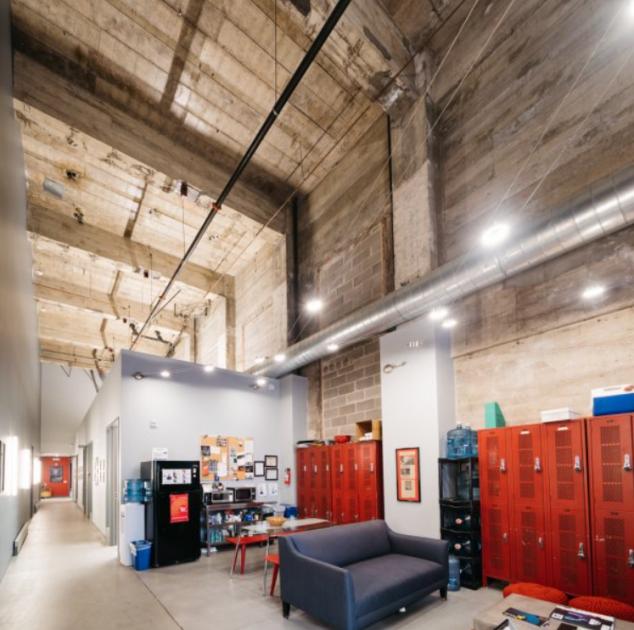
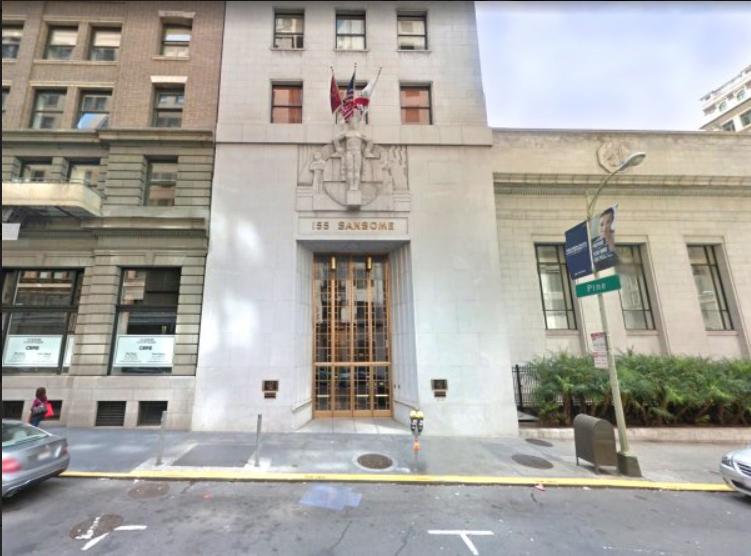
1-Mile | 3-Miles | 5-Miles | ||
---|---|---|---|---|
Total Population | 109,340 | 433,164 | 764,621 | |
Population Median Age | 43 | 39 | 39 | |
Population by Age | 0-9 Yrs | 6086 (5%) | 27087 (6%) | 56415 (7%) |
10-19 Yrs | 4183 (3%) | 24546 (5%) | 56331 (7%) | |
20-29 Yrs | 20385 (18%) | 92814 (21%) | 155663 (20%) | |
30-39 Yrs | 24967 (22%) | 108681 (25%) | 169398 (22%) | |
40-49 Yrs | 15089 (13%) | 56738 (13%) | 101690 (13%) | |
50-59 Yrs | 12558 (11%) | 45245 (10%) | 84110 (11%) | |
60-69 Yrs | 12127 (11%) | 38506 (8%) | 73128 (9%) | |
70+ Yrs | 13945 (12%) | 39545 (9%) | 67887 (8%) | |
Median HH Income | $78,375 | $114,317 | $116,773 | |
Total Household Income | < 24K | 15391 (25%) | 37371 (18%) | 51328 (15%) |
25-49K | 8075 (13%) | 23203 (11%) | 36444 (11%) | |
50-74K | 5548 (9%) | 17274 (8%) | 29588 (9%) | |
75-99K | 4727 (7%) | 15740 (7%) | 26195 (8%) | |
100-199K | 12490 (21%) | 52785 (25%) | 85573 (26%) | |
200K+ | 13074 (22%) | 58880 (28%) | 92176 (28%) | |
Highest Education Level | No Diploma | 16360 | 34906 | 59688 |
Diploma or GED | 10706 | 35869 | 64125 | |
Some College | 11158 | 42222 | 77103 | |
Assoc. Degree | 3371 | 13132 | 26684 | |
Bachelors Degree | 29730 | 132871 | 214468 | |
Higher Degree | 21473 | 91968 | 151686 | |
Total Housing Units | 69,947 | 232,906 | 357,562 | |
--Owner-Occupied | 10,025 | 45,789 | 96,849 | |
--Renter-Occupied | 49,280 | 159,464 | 224,455 | |
Owner-Occupied Values | < 100K | 324 | 1005 | 1702 |
100-199K | 48 | 181 | 579 | |
200-299K | 102 | 741 | 1391 | |
300-399K | 276 | 1399 | 2141 | |
400-499K | 315 | 1112 | 2074 | |
500K+ | 8960 | 41351 | 88963 | |
Total Working Age Population | 101,089 | 394,235 | 679,670 | |
In Work Force | 69,015 | 288,841 | 489,538 | |
Not In Work Force | 32,074 | 105,394 | 190,132 | |
Workforce Employed | 65,361 | 274,800 | 463,559 | |
Workforce Unemployed | 3,646 | 13,871 | 25,532 | |
Civlian Workforce | 69,006 | 288,671 | 489,091 | |
Military Workforce | 8 | 170 | 447 | |
Total Households | 59,305 | 205,253 | 321,304 | |
Family Households | 20,089 | 74,834 | 140,002 | |
Non-Family Households | 39,216 | 130,419 | 181,302 | |
Married Couple | 15,992 | 56,551 | 103,728 | |
Other Family | 4,097 | 18,283 | 36,275 | |
Married w/Child | 4,375 | 17,669 | 36,465 | |
Single Male w/Child | 269 | 1,499 | 2,962 | |
Single Female w/Child | 1,019 | 5,150 | 10,737 |
Population Change Last Two Decades - Plus Projection
2000 | % | 2010 | % | 2020 | % | 2030 | |
---|---|---|---|---|---|---|---|
California | 33,871,648 | +10 | 37,253,956 | +9 | 40,467,295 | +8 | 43,631,295 |
Alameda County | 1,443,741 | +5 | 1,510,271 | +12 | 1,696,752 | +10 | 1,861,027 |
Contra Costa County | 948,816 | +11 | 1,049,025 | +12 | 1,171,305 | +11 | 1,296,786 |
Marin County | 247,289 | +2 | 252,409 | +4 | 263,085 | +2 | 267,912 |
San Francisco County | 776,733 | +4 | 805,235 | +12 | 903,294 | +8 | 976,481 |
Total Working Age Population:
Total Households:
Total Working Age Population:
Total Households:
Total Working Age Population:
Total Households: