Retail Space
901 East Pioneer Parkway Arlington, TX 76010
901 East Pioneer Parkway Arlington, TX 76010

Details & Description
Property Highlights
• The lease is absolute net lease structure with 24 years remaining and 10 5-year options to extend
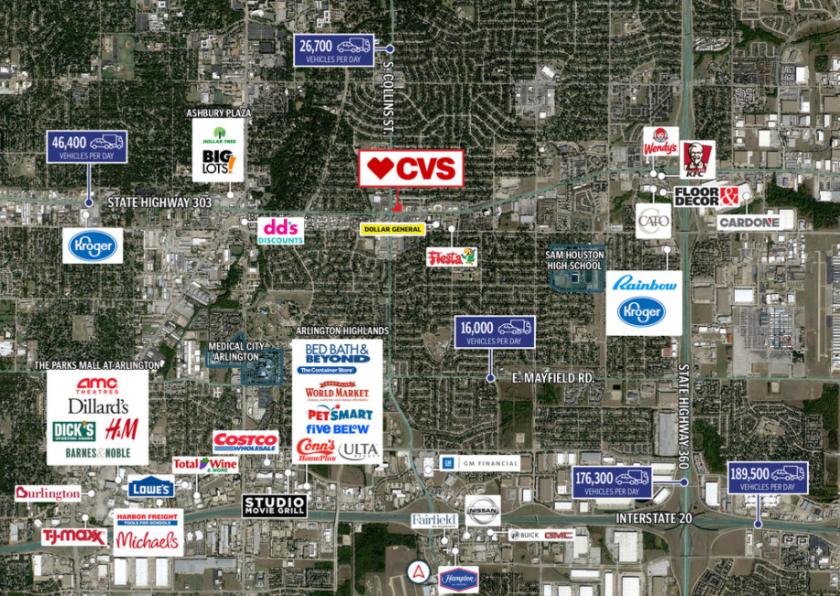
• Nearly 340,000 residents with a healthy average household income of$73,000 support the trade area
Listing Agents

Matthew Mousavi
O: 949-698-1116
M: 714-404-8849
matthew.mousavi@srsre.com
O: 949-698-1116
M: 714-404-8849
matthew.mousavi@srsre.com
While we strive to provide the most accurate information, all listing information, and demographic data, is provided by third-parties. As such, MyEListing will not be responsible for the accuracy of the information. It is strongly recommended that you verify all information with the listing agent, and any relevant agencies, prior to making any decisions.