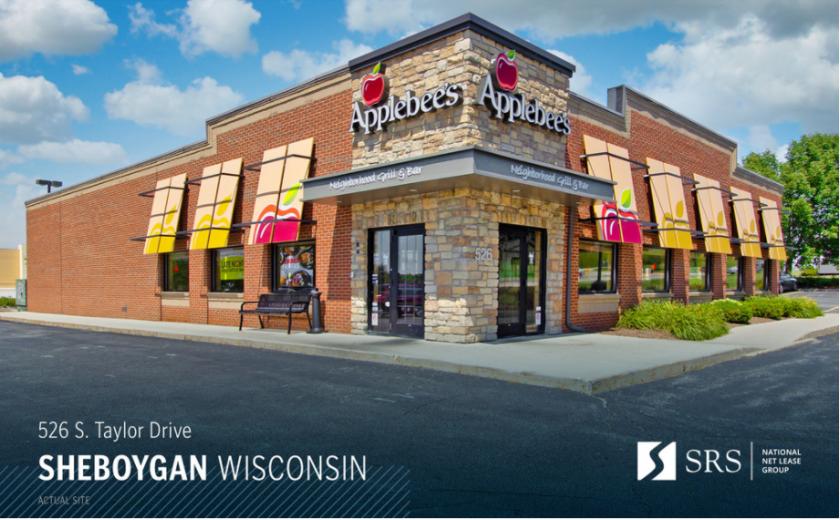
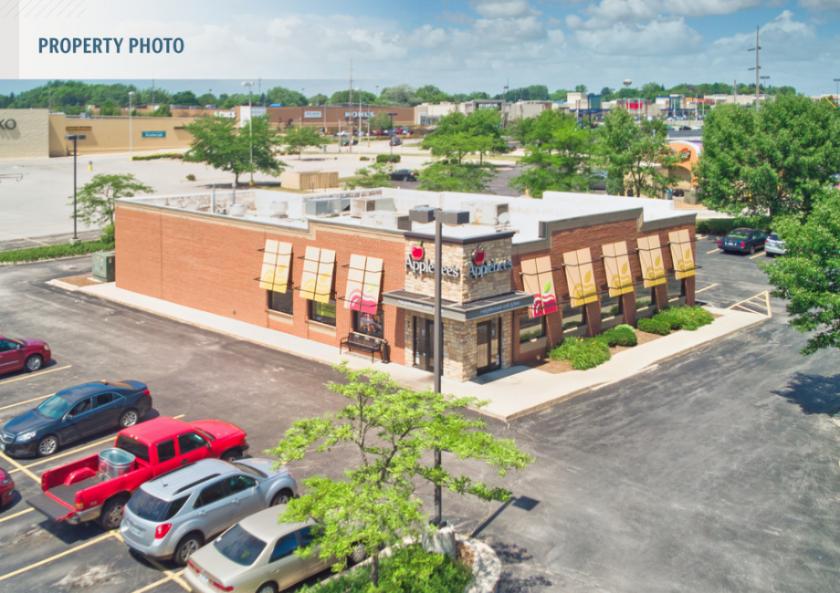
SRS National Net Lease Group is pleased to offer the opportunity to acquire the fee simple interest (land & building ownership) in an absolute NNN leased, franchisee guaranteed, Applebee’s investment property located in Sheboygan, WI. The tenant currently has over 13 years remaining on the lease, with 6 (5-year) options to extend, demonstrating their long-term commitment to the site. The lease features 6.4% rental increases every 5 years throughout the initial term and at the beginning of each option period, steadily growing NOI and hedging against inflation. The lease is absolute NNN with zero landlord responsibilities, and is franchisee guaranteed by a strong 47-unit operator.The Applebee’s property is strategically located along S Taylor Drive (15,900 VPD), which serves as a major retail corridor for Sheboygan. The site is also positioned just off Interstate 43 (31,300 VPD), a highly traveled commuter thoroughfare leading directly into the heart of Milwaukee. Additionally, the asset sits adjacent to the Memorial Mall Shopping Center anchored by Meijer, Kohls, and Bed Bath and Beyond, promoting crossover traffic to the site. Other nearby national/credit tenants include ALDI, a 24-hour Festival Foods, Walgreens, CVS Pharmacy, Big Lots, Pick ‘n Save, Planet Fitness, and more, further increasing consumer draw to the trade area. Moreover, the site is just under a mile south of the St. Nicholas Hospital, a 185-bed medical facility which serves nearly 15,000 patients every year, providing a direct consumer base from which to draw. The 5-mile trade area is supported by a dense population of over 70,500 residents with an average household income of $69,833.