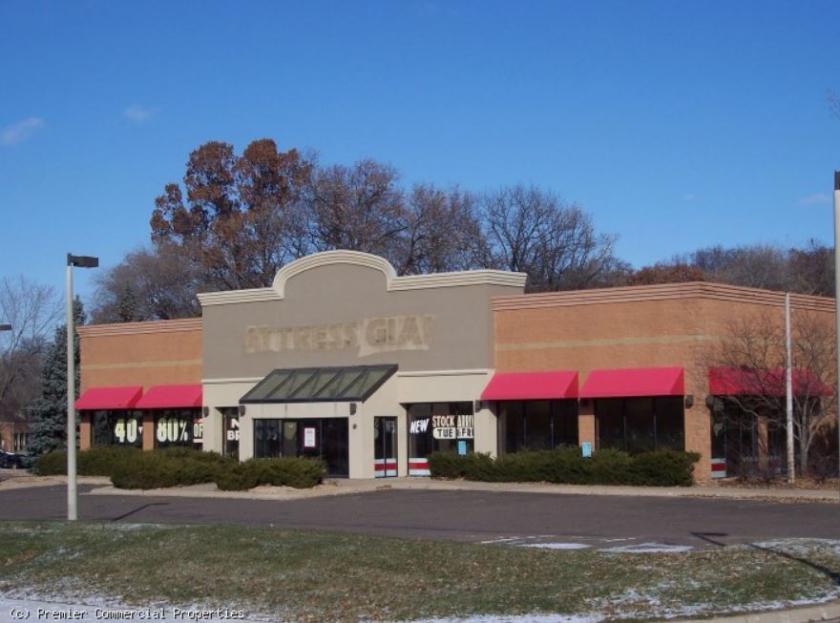
Retail Space
751 County Highway 10 Blaine, MN 55434
751 County Highway 10 Blaine, MN 55434
Details & Description
Property Highlights
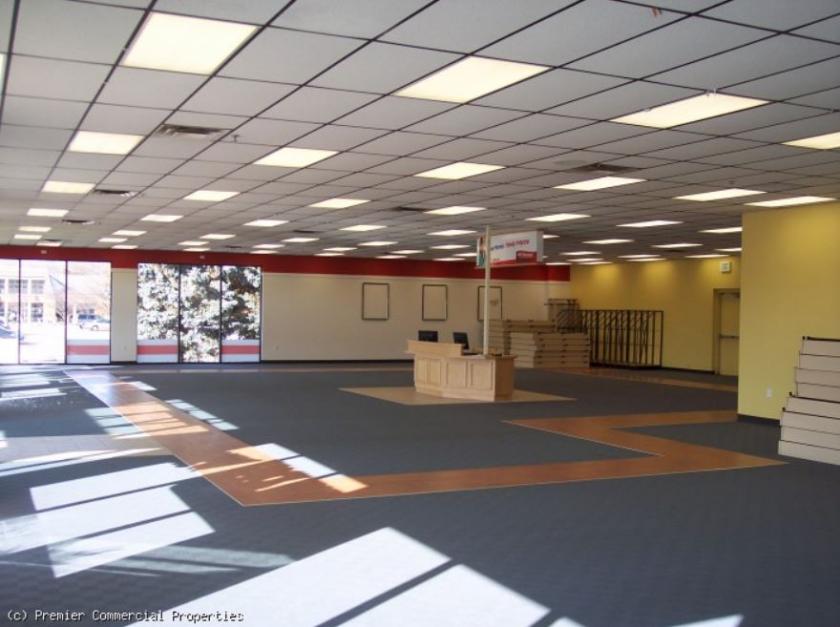
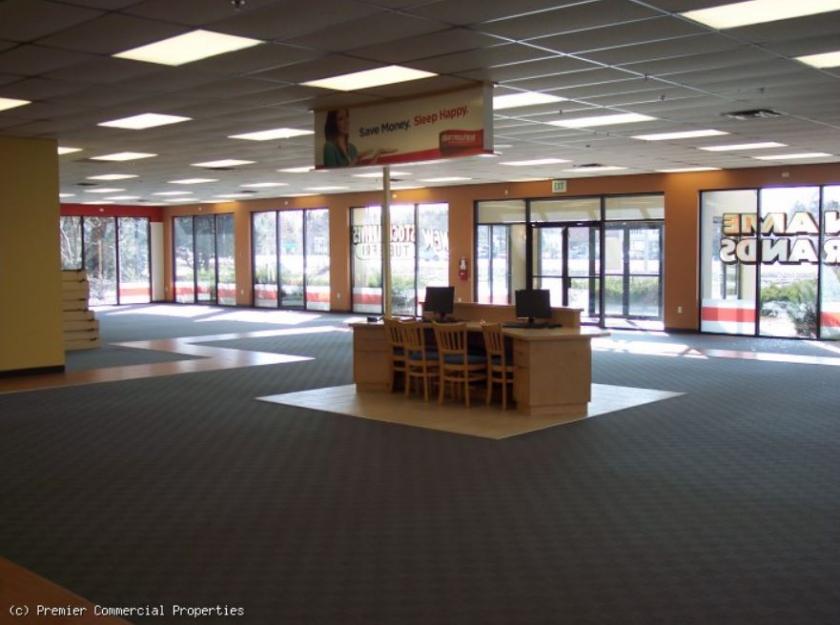
- • Beautiful showroom - all glass with 10 ceilings
- • 24 marked surface stalls
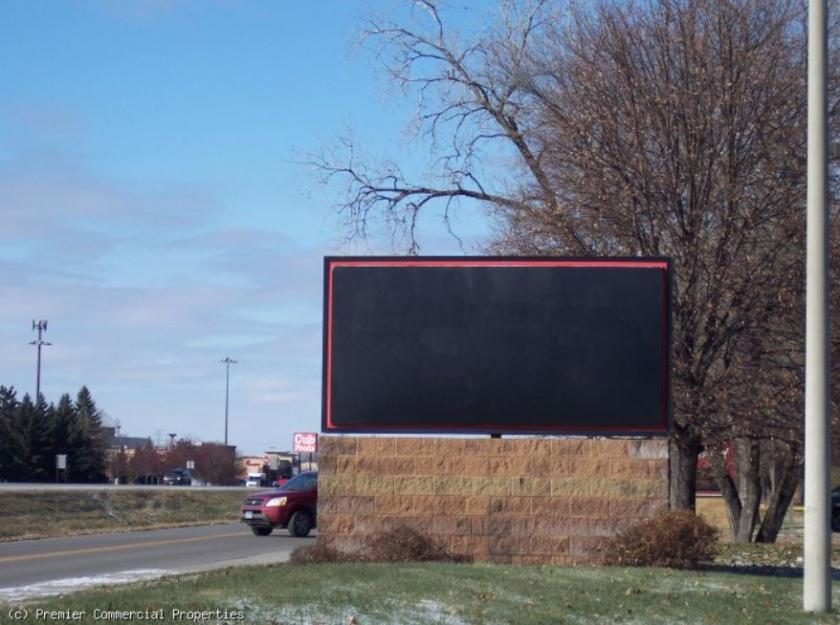
- • Excellent Northtown retail trade area
- • 21,900 vehicles per day
Additional Photos
Listing Agents

Marty Fisher
O: 763-862-2005
M: 612-708-2873
mfisher@premiercommercialproperties.com
O: 763-862-2005
M: 612-708-2873
mfisher@premiercommercialproperties.com
While we strive to provide the most accurate information, all listing information, and demographic data, is provided by third-parties. As such, MyEListing will not be responsible for the accuracy of the information. It is strongly recommended that you verify all information with the listing agent, and any relevant agencies, prior to making any decisions.


