Office Space
400 Fayetteville Street Raleigh, NC 27601
400 Fayetteville Street Raleigh, NC 27601
Details & Description
Property Highlights
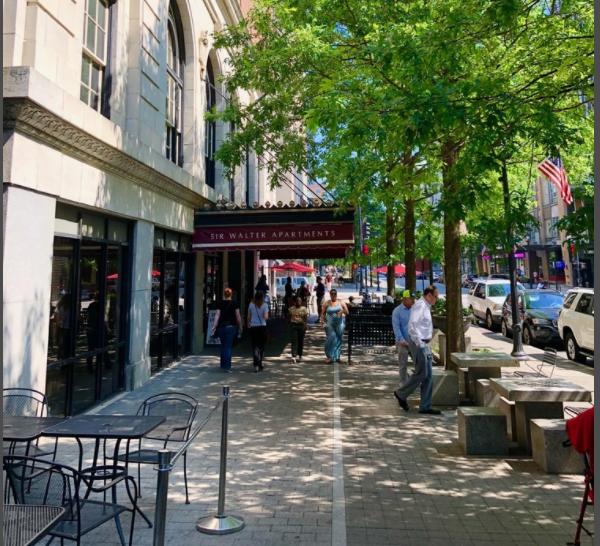
- • Built in 1924
- • Former Sir Walter Hotel
- • Designed by Raleigh architect James A. Slater
- • 94 Walk Score
- • Prime location in Downtown Raleigh
Listing Agents

John Hibbits
O: 919-714-7125
M: 919-606-0989
jhibbits@triprop.com
O: 919-714-7125
M: 919-606-0989
jhibbits@triprop.com
While we strive to provide the most accurate information, all listing information, and demographic data, is provided by third-parties. As such, MyEListing will not be responsible for the accuracy of the information. It is strongly recommended that you verify all information with the listing agent, and any relevant agencies, prior to making any decisions.


