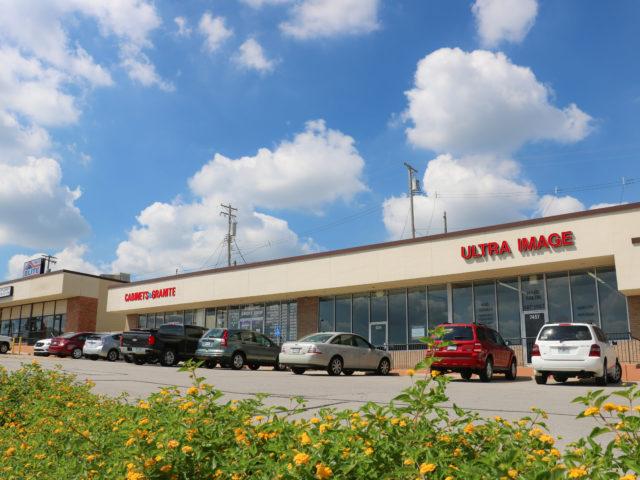
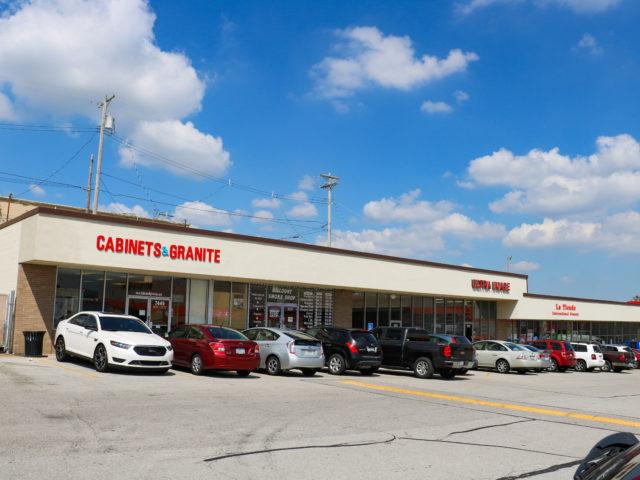
1-Mile | 3-Miles | 5-Miles | ||
---|---|---|---|---|
Total Population | 12,345 | 92,283 | 197,285 | |
Population Median Age | 43 | 42 | 42 | |
Population by Age | 0-9 Yrs | 1196 (9%) | 9456 (10%) | 20261 (10%) |
10-19 Yrs | 1044 (8%) | 9553 (10%) | 20240 (10%) | |
20-29 Yrs | 2044 (16%) | 12427 (13%) | 24338 (12%) | |
30-39 Yrs | 1485 (12%) | 12354 (13%) | 27035 (13%) | |
40-49 Yrs | 1358 (11%) | 9911 (10%) | 21849 (11%) | |
50-59 Yrs | 1748 (14%) | 13284 (14%) | 29245 (14%) | |
60-69 Yrs | 1499 (12%) | 12250 (13%) | 26648 (13%) | |
70+ Yrs | 1972 (15%) | 13049 (14%) | 27668 (14%) | |
Median HH Income | $53,801 | $63,248 | $63,801 | |
Total Household Income | < 24K | 1236 (21%) | 6031 (15%) | 13490 (15%) |
25-49K | 1496 (25%) | 9474 (23%) | 19721 (22%) | |
50-74K | 1040 (18%) | 8350 (20%) | 16604 (19%) | |
75-99K | 730 (12%) | 6271 (15%) | 12728 (14%) | |
100-199K | 1080 (18%) | 8416 (21%) | 18653 (21%) | |
200K+ | 175 (3%) | 1496 (3%) | 4662 (5%) | |
Highest Education Level | No Diploma | 700 | 5228 | 11012 |
Diploma or GED | 2503 | 18660 | 38397 | |
Some College | 2163 | 15345 | 31661 | |
Assoc. Degree | 891 | 6278 | 12625 | |
Bachelors Degree | 1762 | 14012 | 32156 | |
Higher Degree | 1201 | 7469 | 18825 | |
Total Housing Units | 6,110 | 41,820 | 91,004 | |
--Owner-Occupied | 3,582 | 29,368 | 61,888 | |
--Renter-Occupied | 2,175 | 10,670 | 23,970 | |
Owner-Occupied Values | < 100K | 557 | 3177 | 7124 |
100-199K | 2037 | 15933 | 31072 | |
200-299K | 750 | 7596 | 14976 | |
300-399K | 155 | 1926 | 5361 | |
400-499K | 46 | 309 | 1548 | |
500K+ | 36 | 427 | 1807 | |
Total Working Age Population | 10,551 | 77,342 | 165,235 | |
In Work Force | 6,590 | 50,382 | 107,791 | |
Not In Work Force | 3,961 | 26,960 | 57,444 | |
Workforce Employed | 6,345 | 48,705 | 103,794 | |
Workforce Unemployed | 245 | 1,620 | 3,889 | |
Civlian Workforce | 6,590 | 50,325 | 107,683 | |
Military Workforce | 0 | 57 | 109 | |
Total Households | 5,757 | 40,037 | 85,858 | |
Family Households | 3,244 | 24,346 | 51,742 | |
Non-Family Households | 2,513 | 15,691 | 34,116 | |
Married Couple | 2,130 | 18,262 | 39,032 | |
Other Family | 1,113 | 6,084 | 12,710 | |
Married w/Child | 679 | 6,252 | 13,703 | |
Single Male w/Child | 160 | 845 | 1,650 | |
Single Female w/Child | 355 | 1,899 | 4,330 |
Population Change Last Two Decades - Plus Projection
2000 | % | 2010 | % | 2020 | % | 2030 | |
---|---|---|---|---|---|---|---|
Illinois | 12,419,293 | +3 | 12,830,632 | +12 | 14,316,487 | +6 | 15,138,849 |
Monroe County | 27,619 | +19 | 32,957 | +18 | 38,754 | +11 | 43,111 |
St. Clair County | 256,082 | +5 | 270,056 | -6 | 253,924 | -4 | 243,453 |
Missouri | 5,595,211 | +7 | 5,988,927 | +7 | 6,389,850 | +6 | 6,746,762 |
Jefferson County | 198,099 | +10 | 218,733 | +12 | 244,003 | +7 | 260,276 |
St. Charles County | 283,883 | +27 | 360,485 | +22 | 439,068 | +14 | 499,126 |
St. Louis County | 1,016,315 | -2 | 998,954 | -3 | 967,196 | -1 | 956,817 |
St. Louis city | 348,189 | -8 | 319,294 | +10 | 350,385 | 0 | 349,004 |
Total Working Age Population:
Total Households:
Total Working Age Population:
Total Households:
Total Working Age Population:
Total Households: