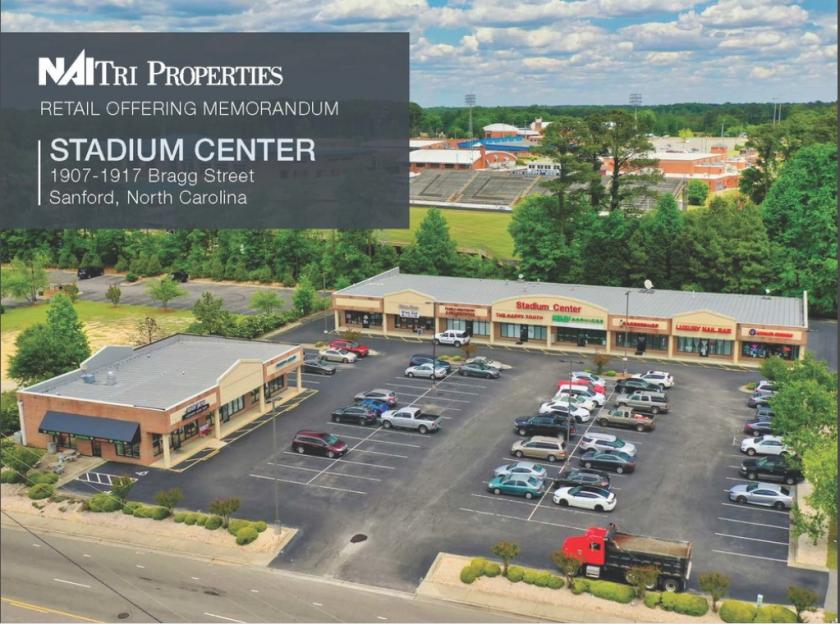
1-Mile | 3-Miles | 5-Miles | ||
---|---|---|---|---|
Total Population | 3,128 | 21,683 | 38,658 | |
Population Median Age | 33 | 36 | 38 | |
Population by Age | 0-9 Yrs | 533 (17%) | 3581 (16%) | 5556 (14%) |
10-19 Yrs | 583 (18%) | 3071 (14%) | 5184 (13%) | |
20-29 Yrs | 379 (12%) | 3031 (13%) | 4802 (12%) | |
30-39 Yrs | 398 (12%) | 2614 (12%) | 4775 (12%) | |
40-49 Yrs | 490 (15%) | 2697 (12%) | 4877 (12%) | |
50-59 Yrs | 339 (10%) | 2874 (13%) | 5036 (13%) | |
60-69 Yrs | 217 (6%) | 2015 (9%) | 4217 (10%) | |
70+ Yrs | 190 (6%) | 1799 (8%) | 4209 (10%) | |
Median HH Income | $31,620 | $37,423 | $46,528 | |
Total Household Income | < 24K | 391 (40%) | 2521 (34%) | 3530 (25%) |
25-49K | 236 (24%) | 2119 (28%) | 4053 (29%) | |
50-74K | 202 (21%) | 1287 (17%) | 2573 (18%) | |
75-99K | 50 (5%) | 673 (9%) | 1628 (11%) | |
100-199K | 78 (8%) | 661 (9%) | 1872 (13%) | |
200K+ | 0 (0%) | 48 (0%) | 305 (2%) | |
Highest Education Level | No Diploma | 626 | 3589 | 4951 |
Diploma or GED | 636 | 4015 | 6911 | |
Some College | 314 | 2958 | 5667 | |
Assoc. Degree | 149 | 1239 | 2838 | |
Bachelors Degree | 76 | 1422 | 3616 | |
Higher Degree | 26 | 468 | 1776 | |
Total Housing Units | 1,170 | 8,296 | 15,474 | |
--Owner-Occupied | 418 | 3,705 | 8,575 | |
--Renter-Occupied | 539 | 3,605 | 5,386 | |
Owner-Occupied Values | < 100K | 252 | 1516 | 2391 |
100-199K | 138 | 1755 | 4025 | |
200-299K | 25 | 320 | 1462 | |
300-399K | 0 | 59 | 458 | |
400-499K | 1 | 24 | 114 | |
500K+ | 2 | 31 | 124 | |
Total Working Age Population | 2,249 | 16,035 | 29,651 | |
In Work Force | 1,362 | 9,823 | 17,925 | |
Not In Work Force | 887 | 6,212 | 11,726 | |
Workforce Employed | 1,262 | 8,950 | 16,454 | |
Workforce Unemployed | 92 | 796 | 1,230 | |
Civlian Workforce | 1,354 | 9,746 | 17,685 | |
Military Workforce | 8 | 76 | 240 | |
Total Households | 957 | 7,310 | 13,961 | |
Family Households | 639 | 4,779 | 9,292 | |
Non-Family Households | 318 | 2,530 | 4,668 | |
Married Couple | 376 | 2,663 | 6,090 | |
Other Family | 264 | 2,117 | 3,203 | |
Married w/Child | 183 | 1,169 | 2,372 | |
Single Male w/Child | 52 | 292 | 430 | |
Single Female w/Child | 105 | 721 | 1,040 |
Population Change Last Two Decades - Plus Projection
2000 | % | 2010 | % | 2020 | % | 2030 | |
---|---|---|---|---|---|---|---|
North Carolina | 8,049,313 | +18 | 9,535,483 | +11 | 10,630,691 | +11 | 11,836,070 |
Chatham County | 49,329 | +29 | 63,505 | +22 | 77,713 | +22 | 94,920 |
Harnett County | 91,025 | +26 | 114,678 | +20 | 137,358 | +15 | 158,563 |
Lee County | 49,040 | +18 | 57,866 | +8 | 62,429 | +9 | 68,325 |
Moore County | 74,769 | +18 | 88,247 | +17 | 102,950 | +16 | 119,674 |
Total Working Age Population:
Total Households:
Total Working Age Population:
Total Households:
Total Working Age Population:
Total Households: