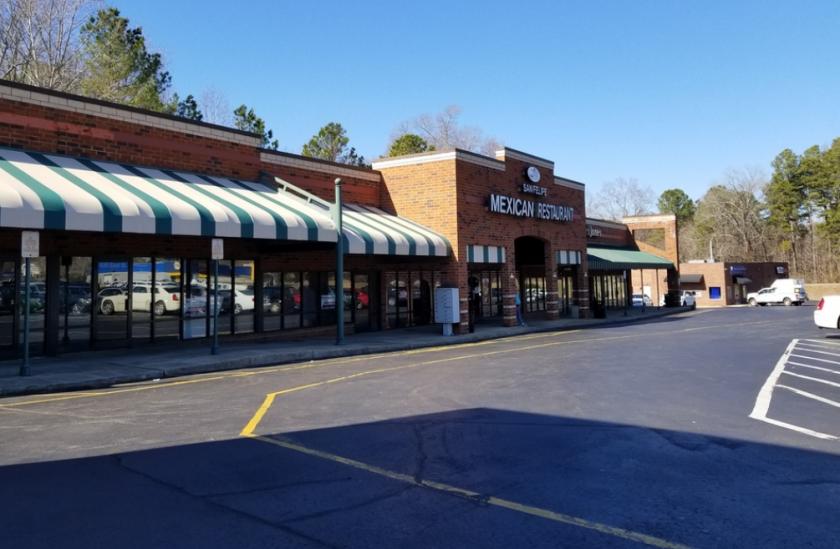
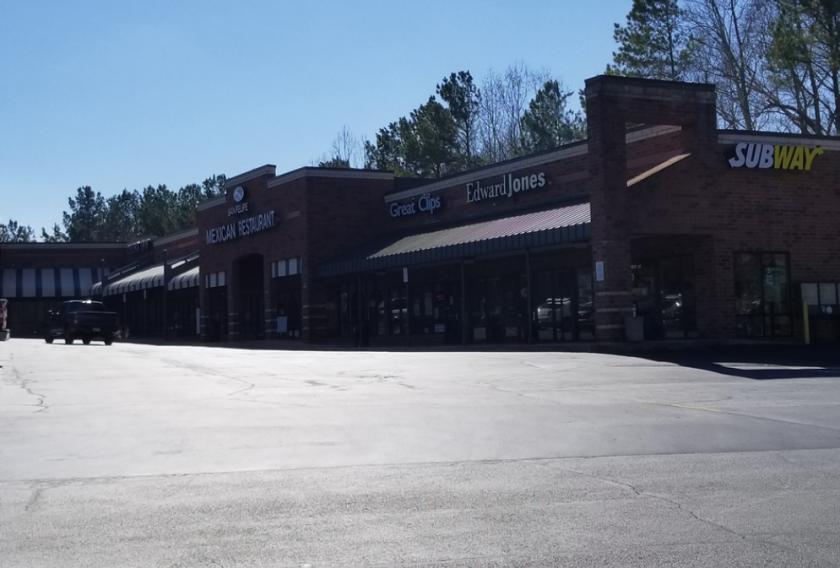
1-Mile | 3-Miles | 5-Miles | ||
---|---|---|---|---|
Total Population | 405 | 3,912 | 9,293 | |
Population Median Age | 46 | 44 | 45 | |
Population by Age | 0-9 Yrs | 31 (7%) | 378 (9%) | 826 (8%) |
10-19 Yrs | 41 (10%) | 359 (9%) | 910 (9%) | |
20-29 Yrs | 36 (8%) | 401 (10%) | 932 (10%) | |
30-39 Yrs | 39 (9%) | 421 (10%) | 957 (10%) | |
40-49 Yrs | 61 (15%) | 531 (13%) | 1256 (13%) | |
50-59 Yrs | 69 (17%) | 604 (15%) | 1532 (16%) | |
60-69 Yrs | 75 (18%) | 702 (17%) | 1660 (17%) | |
70+ Yrs | 53 (13%) | 517 (13%) | 1219 (13%) | |
Median HH Income | $64,228 | $61,364 | $62,690 | |
Total Household Income | < 24K | 32 (18%) | 398 (23%) | 910 (22%) |
25-49K | 37 (21%) | 351 (20%) | 812 (20%) | |
50-74K | 30 (17%) | 264 (15%) | 626 (15%) | |
75-99K | 18 (10%) | 194 (11%) | 477 (11%) | |
100-199K | 42 (24%) | 414 (24%) | 974 (24%) | |
200K+ | 13 (7%) | 98 (5%) | 244 (6%) | |
Highest Education Level | No Diploma | 28 | 272 | 630 |
Diploma or GED | 57 | 559 | 1354 | |
Some College | 49 | 434 | 1094 | |
Assoc. Degree | 40 | 355 | 861 | |
Bachelors Degree | 75 | 762 | 1800 | |
Higher Degree | 61 | 583 | 1301 | |
Total Housing Units | 181 | 1,809 | 4,281 | |
--Owner-Occupied | 142 | 1,287 | 3,054 | |
--Renter-Occupied | 29 | 432 | 989 | |
Owner-Occupied Values | < 100K | 22 | 182 | 449 |
100-199K | 28 | 245 | 595 | |
200-299K | 37 | 350 | 801 | |
300-399K | 25 | 250 | 569 | |
400-499K | 13 | 115 | 281 | |
500K+ | 18 | 146 | 359 | |
Total Working Age Population | 350 | 3,347 | 7,962 | |
In Work Force | 217 | 2,016 | 4,800 | |
Not In Work Force | 132 | 1,331 | 3,163 | |
Workforce Employed | 204 | 1,936 | 4,619 | |
Workforce Unemployed | 13 | 80 | 181 | |
Civlian Workforce | 217 | 2,016 | 4,800 | |
Military Workforce | 0 | 0 | 0 | |
Total Households | 172 | 1,718 | 4,042 | |
Family Households | 118 | 1,100 | 2,646 | |
Non-Family Households | 53 | 619 | 1,396 | |
Married Couple | 96 | 825 | 1,999 | |
Other Family | 23 | 274 | 647 | |
Married w/Child | 28 | 234 | 540 | |
Single Male w/Child | 3 | 22 | 52 | |
Single Female w/Child | 9 | 141 | 316 |
Population Change Last Two Decades - Plus Projection
2000 | % | 2010 | % | 2020 | % | 2030 | |
---|---|---|---|---|---|---|---|
North Carolina | 8,049,313 | +18 | 9,535,483 | +11 | 10,630,691 | +11 | 11,836,070 |
Chatham County | 49,329 | +29 | 63,505 | +22 | 77,713 | +22 | 94,920 |
Total Working Age Population:
Total Households:
Total Working Age Population:
Total Households:
Total Working Age Population:
Total Households: