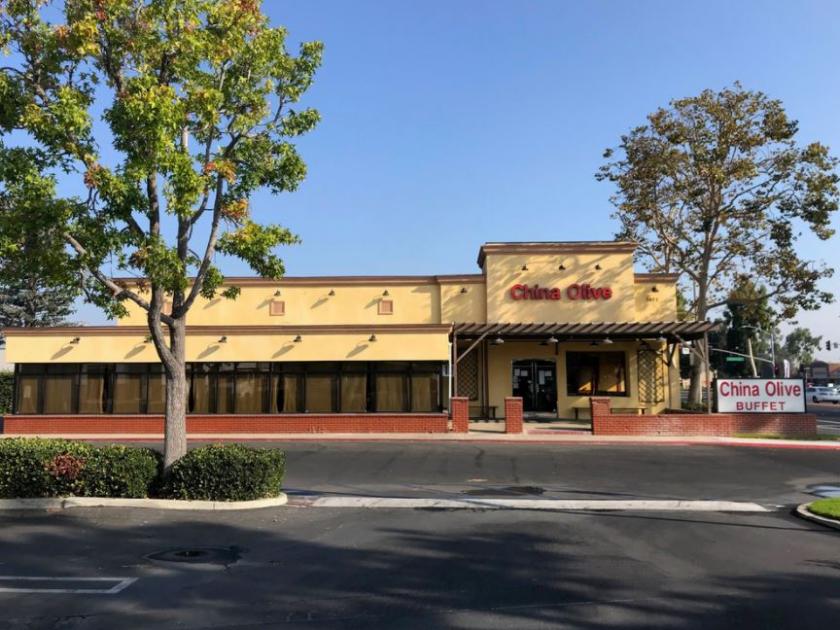
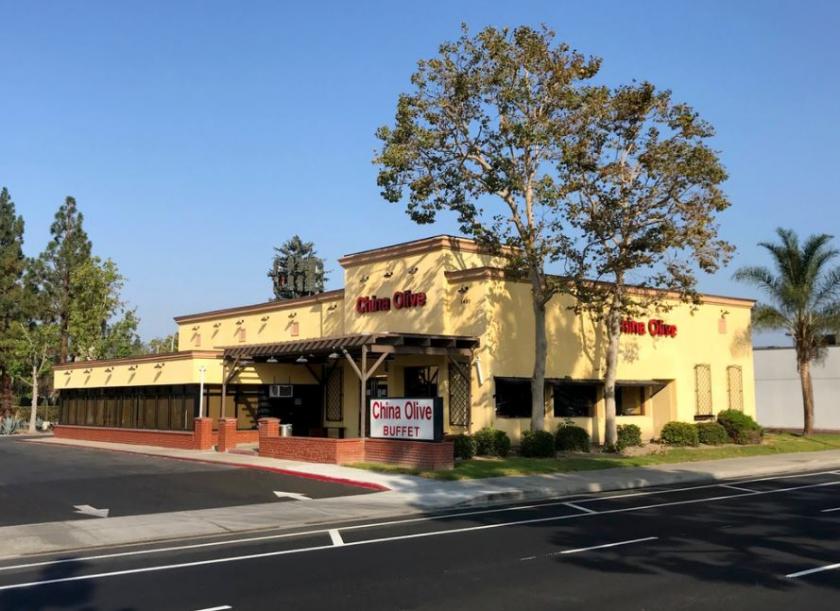
1-Mile | 3-Miles | 5-Miles | ||
---|---|---|---|---|
Total Population | 37,190 | 226,244 | 661,340 | |
Population Median Age | 36 | 35 | 35 | |
Population by Age | 0-9 Yrs | 4232 (11%) | 30236 (13%) | 85667 (12%) |
10-19 Yrs | 4073 (10%) | 29445 (13%) | 92725 (14%) | |
20-29 Yrs | 7141 (19%) | 41999 (18%) | 114372 (17%) | |
30-39 Yrs | 6912 (18%) | 38203 (16%) | 100769 (15%) | |
40-49 Yrs | 4756 (12%) | 28317 (12%) | 86384 (13%) | |
50-59 Yrs | 4390 (11%) | 28194 (12%) | 80354 (12%) | |
60-69 Yrs | 2978 (8%) | 16774 (7%) | 52812 (7%) | |
70+ Yrs | 2708 (7%) | 13078 (5%) | 48256 (7%) | |
Median HH Income | $80,495 | $79,937 | $78,090 | |
Total Household Income | < 24K | 1136 (9%) | 7793 (12%) | 27223 (14%) |
25-49K | 2055 (17%) | 10433 (17%) | 33103 (17%) | |
50-74K | 2123 (18%) | 10488 (17%) | 31542 (16%) | |
75-99K | 1817 (15%) | 9186 (15%) | 25950 (13%) | |
100-199K | 3585 (31%) | 18580 (30%) | 53051 (27%) | |
200K+ | 710 (6%) | 4577 (7%) | 19283 (10%) | |
Highest Education Level | No Diploma | 4941 | 46764 | 109260 |
Diploma or GED | 5637 | 29707 | 82768 | |
Some College | 5431 | 25339 | 76047 | |
Assoc. Degree | 2084 | 8684 | 26048 | |
Bachelors Degree | 5709 | 25567 | 88154 | |
Higher Degree | 2224 | 11011 | 45262 | |
Total Housing Units | 11,973 | 64,182 | 198,957 | |
--Owner-Occupied | 4,785 | 26,459 | 86,774 | |
--Renter-Occupied | 6,640 | 34,598 | 103,378 | |
Owner-Occupied Values | < 100K | 38 | 987 | 4712 |
100-199K | 258 | 491 | 1660 | |
200-299K | 574 | 1506 | 3605 | |
300-399K | 609 | 3079 | 7068 | |
400-499K | 565 | 5396 | 11480 | |
500K+ | 2741 | 15000 | 58250 | |
Total Working Age Population | 30,376 | 178,519 | 522,835 | |
In Work Force | 21,570 | 124,995 | 349,483 | |
Not In Work Force | 8,807 | 53,524 | 173,352 | |
Workforce Employed | 20,710 | 119,274 | 332,542 | |
Workforce Unemployed | 781 | 5,555 | 16,640 | |
Civlian Workforce | 21,491 | 124,829 | 349,182 | |
Military Workforce | 79 | 166 | 301 | |
Total Households | 11,426 | 61,057 | 190,152 | |
Family Households | 7,622 | 43,216 | 134,683 | |
Non-Family Households | 3,804 | 17,840 | 55,469 | |
Married Couple | 5,377 | 30,037 | 96,051 | |
Other Family | 2,244 | 13,179 | 38,633 | |
Married w/Child | 2,123 | 13,656 | 45,705 | |
Single Male w/Child | 267 | 1,581 | 5,070 | |
Single Female w/Child | 595 | 3,654 | 11,532 |
Population Change Last Two Decades - Plus Projection
2000 | % | 2010 | % | 2020 | % | 2030 | |
---|---|---|---|---|---|---|---|
California | 33,871,648 | +10 | 37,253,956 | +9 | 40,467,295 | +8 | 43,631,295 |
Los Angeles County | 9,519,338 | +3 | 9,818,605 | +6 | 10,369,367 | +4 | 10,759,850 |
Orange County | 2,846,289 | +6 | 3,010,232 | +8 | 3,257,087 | +5 | 3,431,096 |
Total Working Age Population:
Total Households:
Total Working Age Population:
Total Households:
Total Working Age Population:
Total Households: