Office Space
1700 Livingston Avenue Saint Paul, MN 55118
1700 Livingston Avenue Saint Paul, MN 55118

Details & Description
Property Highlights
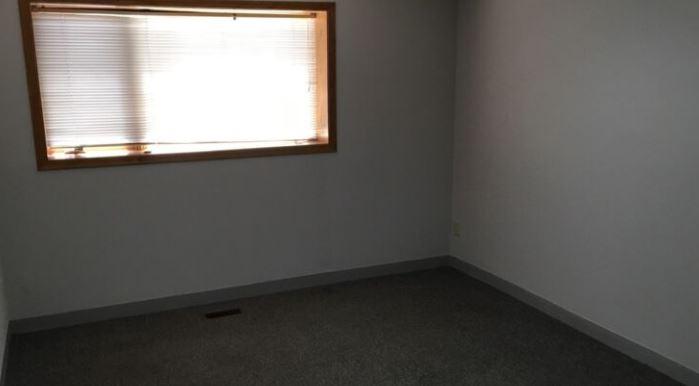
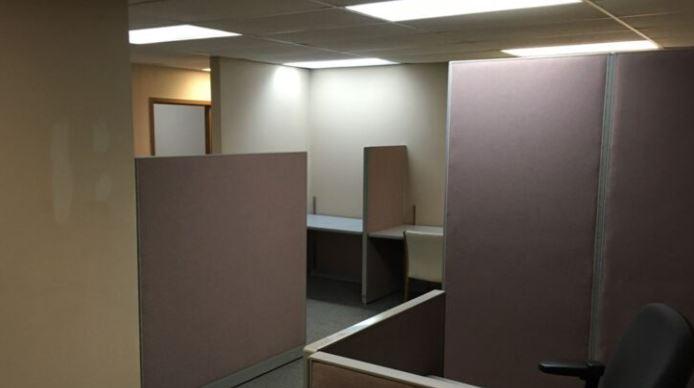
- • West St. Paul office space available FOR LEASE
- • 6 Private Offices in the Suite
- • Excellent location off high traffic Robert Street
Additional Photos

Listing Agents

Chad Weeks
O: 763-424-6355
M: 612-619-9911
cweeks@arrowcos.com
O: 763-424-6355
M: 612-619-9911
cweeks@arrowcos.com
While we strive to provide the most accurate information, all listing information, and demographic data, is provided by third-parties. As such, MyEListing will not be responsible for the accuracy of the information. It is strongly recommended that you verify all information with the listing agent, and any relevant agencies, prior to making any decisions.


