Retail Space
9292 Metcalf Avenue Overland Park, KS 66212
9292 Metcalf Avenue Overland Park, KS 66212
Details & Description
Property Highlights
- • Ground Lease or Build-to-Suit
- • New building can accommodate a drive-thru
- • Lot Size .50 Acres
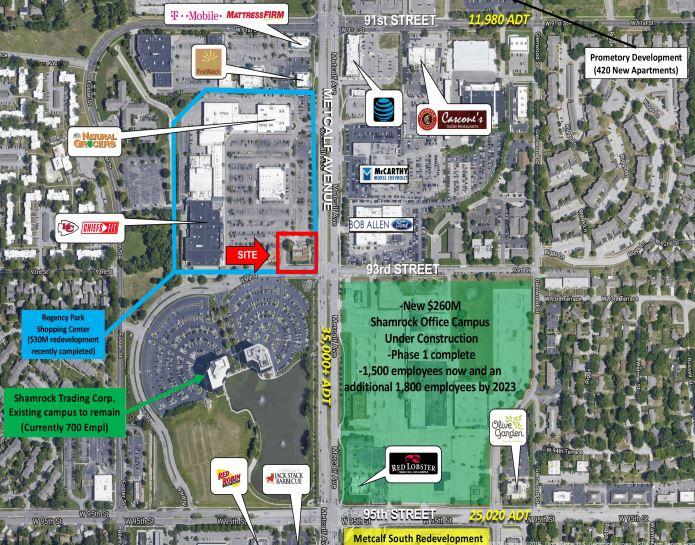
- • Hard corner out-parcel
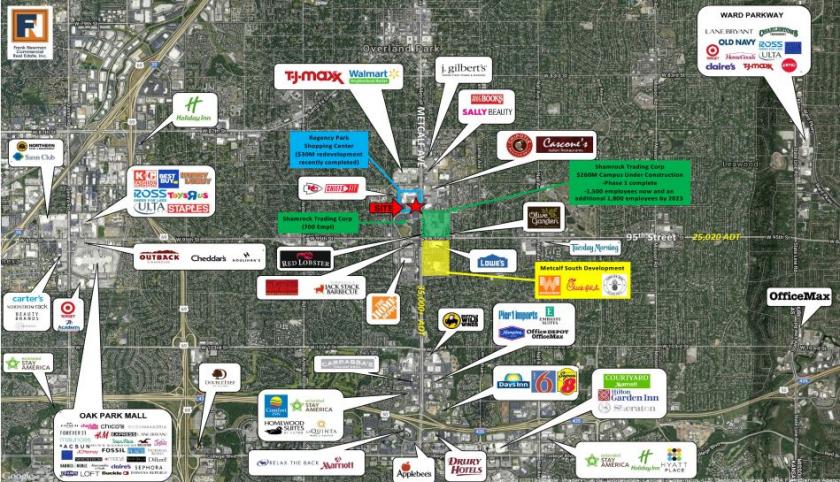
- • Over 35,000 cars daily on Metcalf Ave
Listing Agents

Frank Newman
O: 816-531-1050
M: 913-340-5757
frank@franknewmancommercial.com
O: 816-531-1050
M: 913-340-5757
frank@franknewmancommercial.com
While we strive to provide the most accurate information, all listing information, and demographic data, is provided by third-parties. As such, MyEListing will not be responsible for the accuracy of the information. It is strongly recommended that you verify all information with the listing agent, and any relevant agencies, prior to making any decisions.