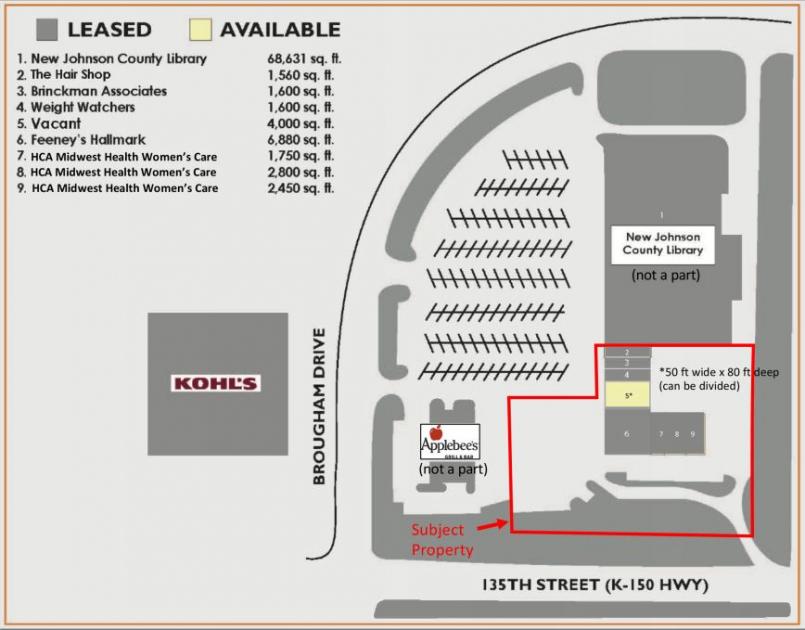
1-Mile | 3-Miles | 5-Miles | ||
---|---|---|---|---|
Total Population | 11,849 | 99,502 | 198,461 | |
Population Median Age | 35 | 36 | 36 | |
Population by Age | 0-9 Yrs | 1735 (14%) | 13810 (13%) | 27751 (13%) |
10-19 Yrs | 1751 (14%) | 14899 (14%) | 30149 (15%) | |
20-29 Yrs | 1666 (14%) | 13456 (13%) | 24004 (12%) | |
30-39 Yrs | 1747 (14%) | 14939 (15%) | 28548 (14%) | |
40-49 Yrs | 1585 (13%) | 13617 (13%) | 29038 (14%) | |
50-59 Yrs | 1674 (14%) | 13243 (13%) | 26170 (13%) | |
60-69 Yrs | 863 (7%) | 8878 (8%) | 18990 (9%) | |
70+ Yrs | 827 (6%) | 6661 (6%) | 13811 (6%) | |
Median HH Income | $69,261 | $84,717 | $93,939 | |
Total Household Income | < 24K | 602 (13%) | 3498 (9%) | 6018 (8%) |
25-49K | 926 (20%) | 6637 (18%) | 11160 (15%) | |
50-74K | 909 (20%) | 5921 (16%) | 11024 (15%) | |
75-99K | 418 (9%) | 5671 (15%) | 10626 (14%) | |
100-199K | 1411 (31%) | 11881 (32%) | 24996 (34%) | |
200K+ | 235 (5%) | 2913 (7%) | 8681 (11%) | |
Highest Education Level | No Diploma | 482 | 3874 | 6338 |
Diploma or GED | 1097 | 10461 | 17974 | |
Some College | 1602 | 12505 | 22774 | |
Assoc. Degree | 675 | 5124 | 9716 | |
Bachelors Degree | 2502 | 21267 | 45289 | |
Higher Degree | 1083 | 10916 | 26430 | |
Total Housing Units | 4,678 | 38,232 | 75,431 | |
--Owner-Occupied | 2,573 | 23,583 | 50,139 | |
--Renter-Occupied | 1,927 | 12,937 | 22,366 | |
Owner-Occupied Values | < 100K | 128 | 1183 | 2115 |
100-199K | 1028 | 7827 | 11743 | |
200-299K | 992 | 9197 | 18057 | |
300-399K | 357 | 3468 | 9665 | |
400-499K | 46 | 1294 | 4722 | |
500K+ | 22 | 614 | 3836 | |
Total Working Age Population | 8,998 | 76,321 | 151,524 | |
In Work Force | 6,766 | 57,549 | 112,368 | |
Not In Work Force | 2,232 | 18,772 | 39,156 | |
Workforce Employed | 6,533 | 55,539 | 109,005 | |
Workforce Unemployed | 214 | 1,840 | 3,151 | |
Civlian Workforce | 6,747 | 57,379 | 112,156 | |
Military Workforce | 19 | 170 | 212 | |
Total Households | 4,500 | 36,520 | 72,505 | |
Family Households | 2,960 | 25,243 | 52,085 | |
Non-Family Households | 1,540 | 11,277 | 20,420 | |
Married Couple | 2,260 | 19,823 | 42,659 | |
Other Family | 701 | 5,420 | 9,426 | |
Married w/Child | 1,107 | 9,522 | 20,712 | |
Single Male w/Child | 117 | 922 | 1,643 | |
Single Female w/Child | 370 | 2,585 | 4,387 |
Population Change Last Two Decades - Plus Projection
2000 | % | 2010 | % | 2020 | % | 2030 | |
---|---|---|---|---|---|---|---|
Kansas | 2,688,418 | +6 | 2,853,118 | +5 | 2,988,194 | +5 | 3,140,008 |
Johnson County | 451,086 | +21 | 544,179 | +15 | 625,524 | +17 | 734,065 |
Leavenworth County | 68,691 | +11 | 76,227 | +10 | 83,566 | +11 | 92,787 |
Total Working Age Population:
Total Households:
Total Working Age Population:
Total Households:
Total Working Age Population:
Total Households: