Industrial Properties
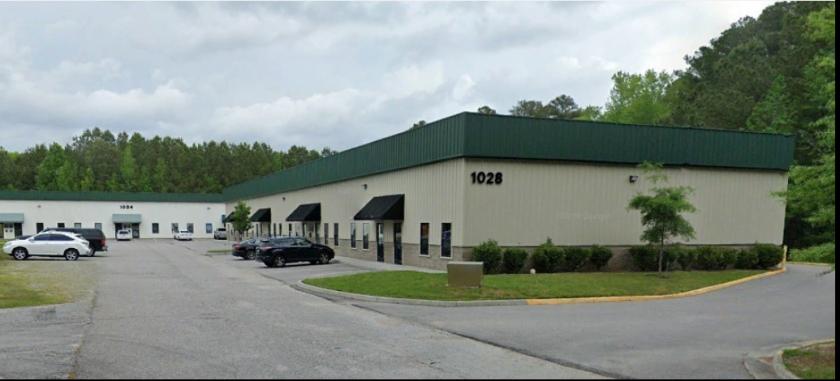
1032 Bells Road Virginia Beach, VA 23451
1032 Bells Road Virginia Beach, VA 23451

Details & Description
Listing Agents

Brian Baker
O: 757-448-8120
brian@katsias.com
O: 757-448-8120
brian@katsias.com
While we strive to provide the most accurate information, all listing information, and demographic data, is provided by third-parties. As such, MyEListing will not be responsible for the accuracy of the information. It is strongly recommended that you verify all information with the listing agent, and any relevant agencies, prior to making any decisions.