Industrial Properties
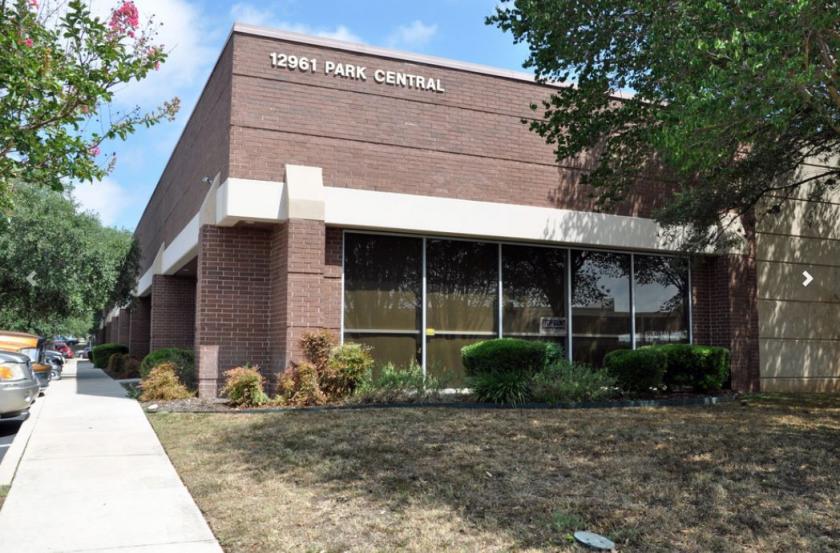
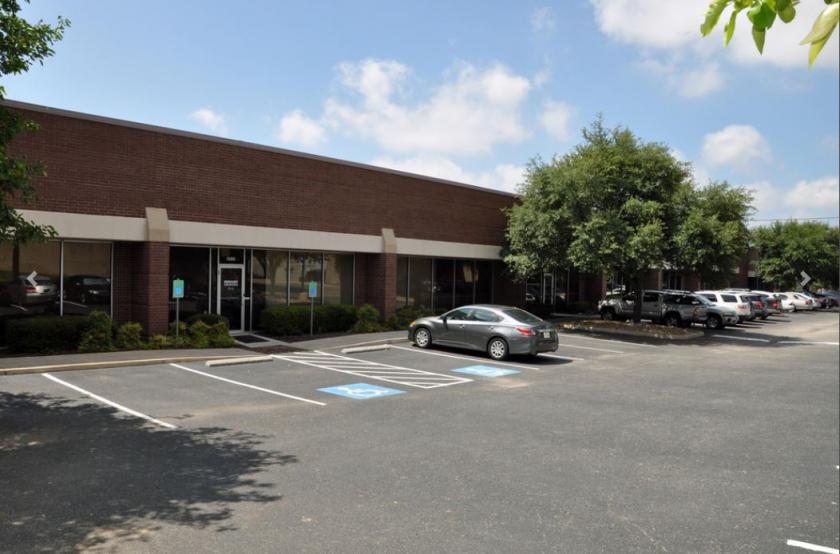
121 Interpark Boulevard San Antonio, TX 78216
121 Interpark Boulevard San Antonio, TX 78216
Details & Description
Listing Agents

Rob Gish
O: 210-805-3370
M: 210-279-2210
robg@worthsa.com
O: 210-805-3370
M: 210-279-2210
robg@worthsa.com
While we strive to provide the most accurate information, all listing information, and demographic data, is provided by third-parties. As such, MyEListing will not be responsible for the accuracy of the information. It is strongly recommended that you verify all information with the listing agent, and any relevant agencies, prior to making any decisions.