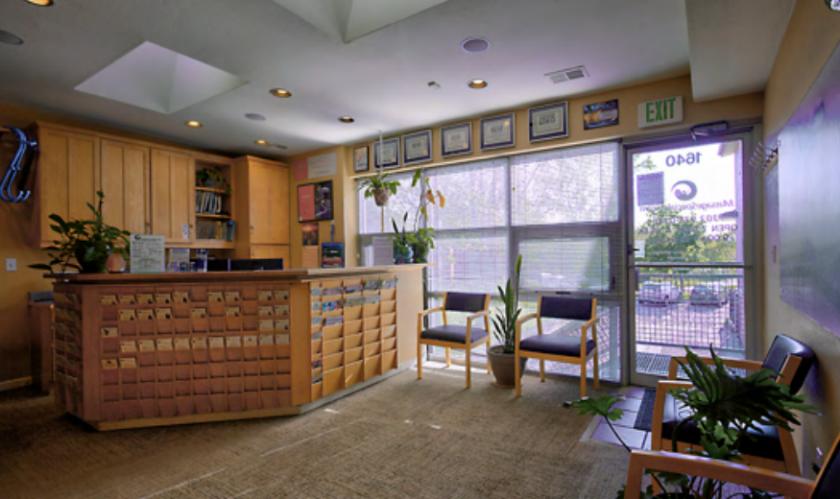
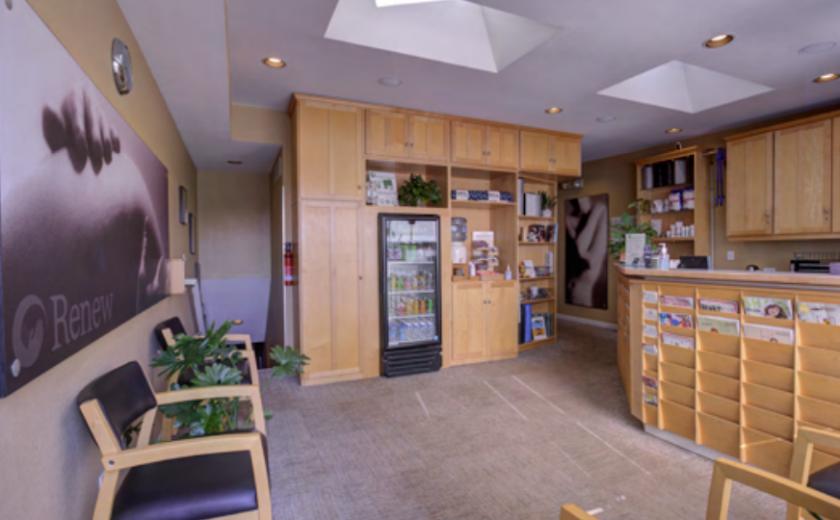
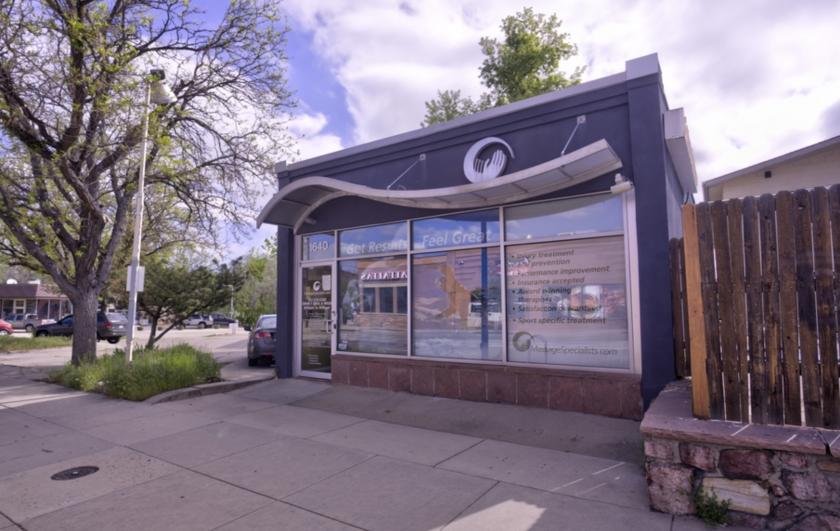
1-Mile | 3-Miles | 5-Miles | ||
---|---|---|---|---|
Total Population | 26,574 | 93,172 | 115,036 | |
Population Median Age | 30 | 35 | 36 | |
Population by Age | 0-9 Yrs | 943 (3%) | 5542 (5%) | 7449 (6%) |
10-19 Yrs | 5058 (19%) | 14667 (15%) | 16920 (14%) | |
20-29 Yrs | 12378 (46%) | 30832 (33%) | 34256 (29%) | |
30-39 Yrs | 2612 (9%) | 10887 (11%) | 13829 (12%) | |
40-49 Yrs | 1381 (5%) | 8124 (8%) | 11272 (9%) | |
50-59 Yrs | 1767 (6%) | 8488 (9%) | 11568 (10%) | |
60-69 Yrs | 1381 (5%) | 7718 (8%) | 10760 (9%) | |
70+ Yrs | 1054 (3%) | 6914 (7%) | 8982 (7%) | |
Median HH Income | $44,824 | $65,318 | $71,271 | |
Total Household Income | < 24K | 3154 (32%) | 8329 (22%) | 9352 (20%) |
25-49K | 1973 (20%) | 6625 (18%) | 7859 (17%) | |
50-74K | 1422 (14%) | 5186 (14%) | 6629 (14%) | |
75-99K | 720 (7%) | 3378 (9%) | 4462 (9%) | |
100-199K | 1482 (15%) | 7853 (21%) | 10452 (22%) | |
200K+ | 883 (9%) | 5215 (14%) | 7102 (15%) | |
Highest Education Level | No Diploma | 207 | 1628 | 2049 |
Diploma or GED | 480 | 3151 | 4363 | |
Some College | 1161 | 5705 | 7507 | |
Assoc. Degree | 309 | 1762 | 2613 | |
Bachelors Degree | 4502 | 19056 | 24975 | |
Higher Degree | 4219 | 20459 | 26401 | |
Total Housing Units | 10,599 | 39,360 | 49,007 | |
--Owner-Occupied | 2,539 | 17,100 | 23,487 | |
--Renter-Occupied | 7,094 | 19,486 | 22,370 | |
Owner-Occupied Values | < 100K | 35 | 1080 | 1438 |
100-199K | 103 | 720 | 1103 | |
200-299K | 45 | 689 | 1053 | |
300-399K | 171 | 1021 | 1525 | |
400-499K | 106 | 1143 | 1659 | |
500K+ | 2080 | 12448 | 16709 | |
Total Working Age Population | 25,146 | 83,790 | 102,445 | |
In Work Force | 15,721 | 54,936 | 67,763 | |
Not In Work Force | 9,425 | 28,854 | 34,682 | |
Workforce Employed | 14,828 | 52,502 | 64,848 | |
Workforce Unemployed | 884 | 2,416 | 2,897 | |
Civlian Workforce | 15,712 | 54,918 | 67,745 | |
Military Workforce | 9 | 18 | 18 | |
Total Households | 9,633 | 36,585 | 45,856 | |
Family Households | 2,429 | 14,645 | 19,968 | |
Non-Family Households | 7,204 | 21,941 | 25,888 | |
Married Couple | 1,889 | 12,093 | 16,477 | |
Other Family | 541 | 2,552 | 3,491 | |
Married w/Child | 714 | 4,865 | 6,458 | |
Single Male w/Child | 65 | 469 | 562 | |
Single Female w/Child | 192 | 848 | 1,295 |
Population Change Last Two Decades - Plus Projection
2000 | % | 2010 | % | 2020 | % | 2030 | |
---|---|---|---|---|---|---|---|
Colorado | 4,301,261 | +17 | 5,029,196 | +16 | 5,838,181 | +15 | 6,733,658 |
Boulder County | 291,288 | +1 | 294,567 | +13 | 332,134 | +12 | 370,618 |
Total Working Age Population:
Total Households:
Total Working Age Population:
Total Households:
Total Working Age Population:
Total Households: