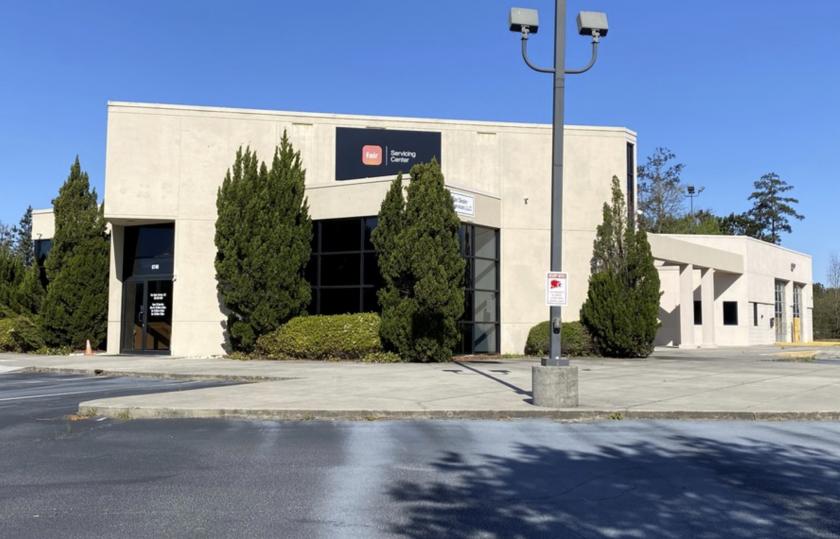
Retail Space
6740 Oakley Industrial Boulevard Union City, GA 30291
6740 Oakley Industrial Boulevard Union City, GA 30291
Details & Description
Property Highlights
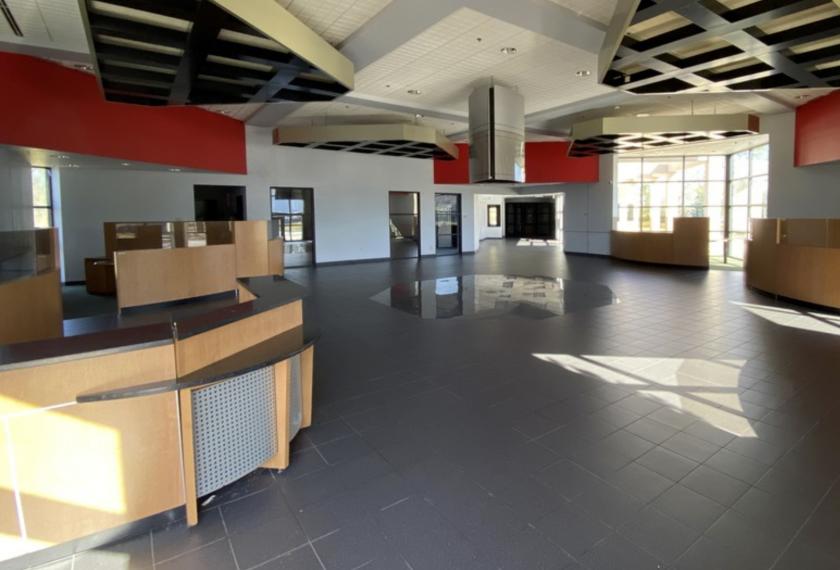
- • 12,818 SF Automotive Dealership on 3.5 Acres
- • 225 Parking Spaces with Gated Lot
- • 7 Service Bays
Listing Agents

Ellen Grisette
O: 678-420-1392
M: 404-861-5188
ellen.grisette@srsre.com
O: 678-420-1392
M: 404-861-5188
ellen.grisette@srsre.com
While we strive to provide the most accurate information, all listing information, and demographic data, is provided by third-parties. As such, MyEListing will not be responsible for the accuracy of the information. It is strongly recommended that you verify all information with the listing agent, and any relevant agencies, prior to making any decisions.