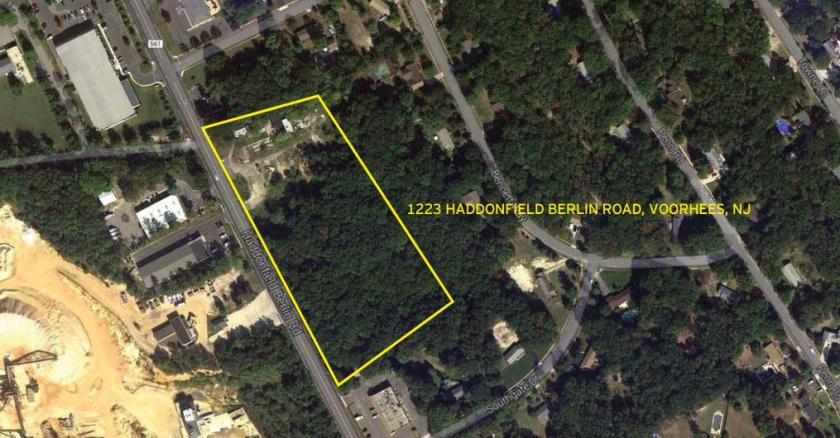
1-Mile | 3-Miles | 5-Miles | ||
---|---|---|---|---|
Total Population | 5,064 | 54,339 | 162,841 | |
Population Median Age | 41 | 40 | 41 | |
Population by Age | 0-9 Yrs | 403 (7%) | 6244 (11%) | 18362 (11%) |
10-19 Yrs | 804 (15%) | 7001 (12%) | 19565 (12%) | |
20-29 Yrs | 656 (12%) | 6935 (12%) | 20630 (12%) | |
30-39 Yrs | 362 (7%) | 6202 (11%) | 19682 (12%) | |
40-49 Yrs | 722 (14%) | 7492 (13%) | 21595 (13%) | |
50-59 Yrs | 1005 (19%) | 7607 (13%) | 24620 (15%) | |
60-69 Yrs | 512 (10%) | 6310 (11%) | 19036 (11%) | |
70+ Yrs | 601 (11%) | 6549 (12%) | 19352 (11%) | |
Median HH Income | $80,967 | $75,570 | $81,470 | |
Total Household Income | < 24K | 302 (17%) | 3526 (17%) | 8839 (14%) |
25-49K | 335 (19%) | 3483 (17%) | 10461 (16%) | |
50-74K | 185 (10%) | 3097 (15%) | 9707 (15%) | |
75-99K | 188 (10%) | 2565 (12%) | 7939 (12%) | |
100-199K | 443 (25%) | 5108 (25%) | 17850 (28%) | |
200K+ | 280 (16%) | 2551 (12%) | 7328 (11%) | |
Highest Education Level | No Diploma | 506 | 3590 | 8774 |
Diploma or GED | 1041 | 10858 | 31496 | |
Some College | 535 | 6947 | 21581 | |
Assoc. Degree | 194 | 2544 | 8102 | |
Bachelors Degree | 865 | 8710 | 27785 | |
Higher Degree | 443 | 5265 | 17562 | |
Total Housing Units | 1,882 | 22,278 | 67,408 | |
--Owner-Occupied | 1,374 | 13,919 | 44,529 | |
--Renter-Occupied | 358 | 6,411 | 17,596 | |
Owner-Occupied Values | < 100K | 75 | 1033 | 3310 |
100-199K | 497 | 5009 | 15524 | |
200-299K | 265 | 2880 | 12354 | |
300-399K | 361 | 2487 | 7523 | |
400-499K | 148 | 1620 | 3372 | |
500K+ | 29 | 890 | 2445 | |
Total Working Age Population | 4,177 | 43,828 | 132,626 | |
In Work Force | 2,899 | 28,927 | 89,064 | |
Not In Work Force | 1,278 | 14,900 | 43,562 | |
Workforce Employed | 2,745 | 27,180 | 83,937 | |
Workforce Unemployed | 143 | 1,684 | 5,022 | |
Civlian Workforce | 2,887 | 28,864 | 88,959 | |
Military Workforce | 12 | 63 | 105 | |
Total Households | 1,733 | 20,330 | 62,124 | |
Family Households | 1,287 | 13,778 | 41,560 | |
Non-Family Households | 446 | 6,552 | 20,564 | |
Married Couple | 955 | 9,942 | 31,400 | |
Other Family | 332 | 3,837 | 10,161 | |
Married w/Child | 368 | 3,798 | 12,371 | |
Single Male w/Child | 21 | 404 | 1,177 | |
Single Female w/Child | 60 | 1,348 | 3,612 |
Population Change Last Two Decades - Plus Projection
2000 | % | 2010 | % | 2020 | % | 2030 | |
---|---|---|---|---|---|---|---|
New Jersey | 8,414,350 | +4 | 8,791,894 | +4 | 9,132,700 | +4 | 9,530,900 |
Burlington County | 423,394 | +6 | 448,734 | 0 | 450,000 | +3 | 464,900 |
Camden County | 508,932 | +1 | 513,657 | 0 | 511,800 | +2 | 521,000 |
Gloucester County | 254,673 | +13 | 288,288 | +1 | 292,000 | +5 | 305,800 |
Pennsylvania | 12,281,054 | +3 | 12,702,379 | +4 | 13,230,170 | +4 | 13,759,594 |
Philadelphia County | 1,517,550 | +1 | 1,526,006 | +8 | 1,653,729 | +6 | 1,753,054 |
Total Working Age Population:
Total Households:
Total Working Age Population:
Total Households:
Total Working Age Population:
Total Households: