Retail Space
SWC Germann Rd. Gilbert Rd Chandler, AZ 85286
SWC Germann Rd. Gilbert Rd Chandler, AZ 85286

Details & Description
Property Highlights
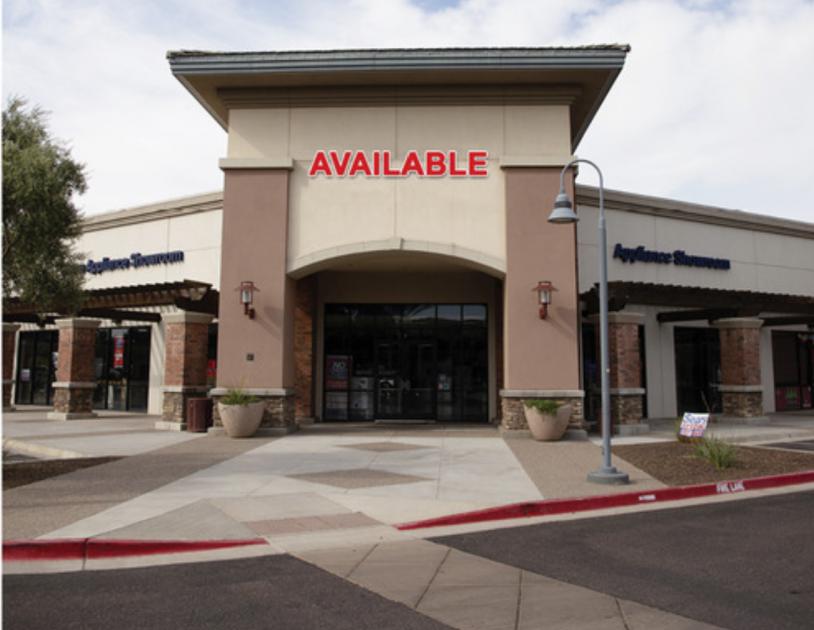
• Conveniently located near schools, hospitals, desirable residential developments and the Chandler Airpark
• Sears Home Appliance Showroom and Shoe Carnival spaces available for lease DO NOT DISTURB TENANTS
Listing Agents

Chuck Gibson
O: 602-682-6035
M: 480-363-9030
chuck.gibson@srsre.com
O: 602-682-6035
M: 480-363-9030
chuck.gibson@srsre.com
While we strive to provide the most accurate information, all listing information, and demographic data, is provided by third-parties. As such, MyEListing will not be responsible for the accuracy of the information. It is strongly recommended that you verify all information with the listing agent, and any relevant agencies, prior to making any decisions.