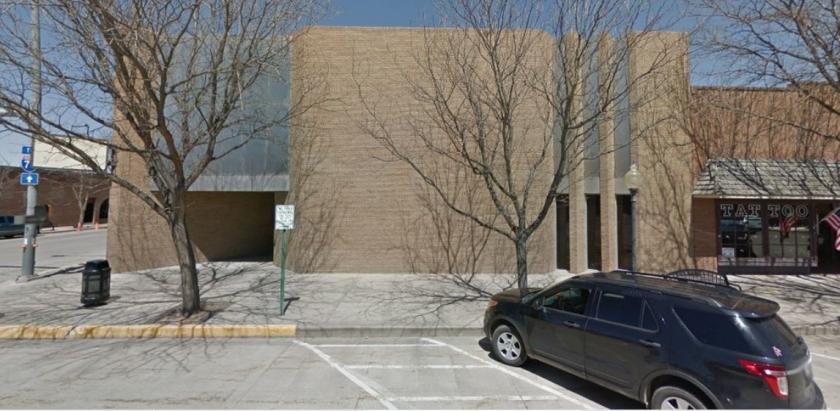
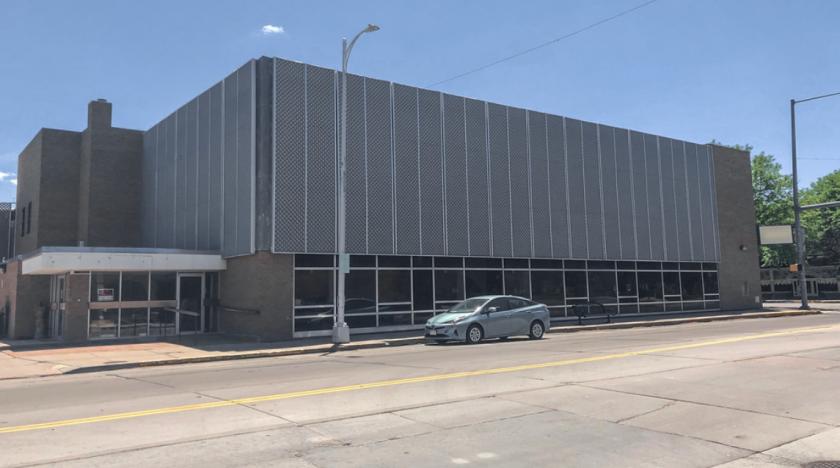
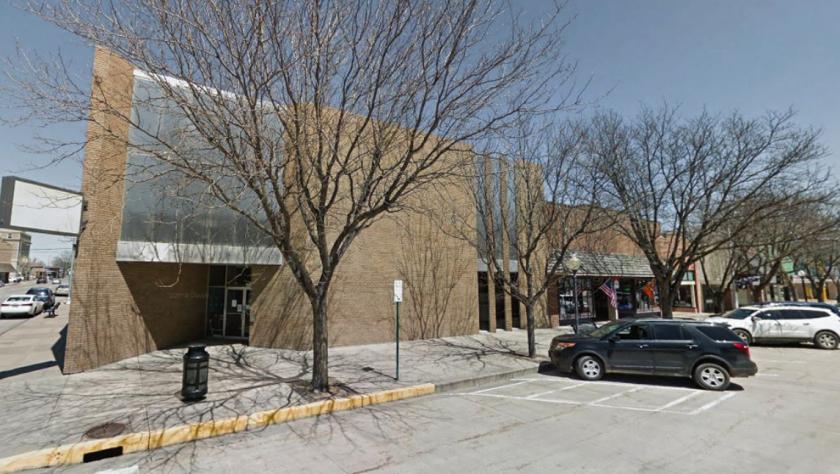
1-Mile | 3-Miles | 5-Miles | ||
---|---|---|---|---|
Total Population | 6,903 | 12,625 | 15,733 | |
Population Median Age | 40 | 39 | 39 | |
Population by Age | 0-9 Yrs | 627 (9%) | 1610 (12%) | 1971 (12%) |
10-19 Yrs | 928 (13%) | 1602 (12%) | 2075 (13%) | |
20-29 Yrs | 1097 (15%) | 1880 (14%) | 2281 (14%) | |
30-39 Yrs | 960 (13%) | 1676 (13%) | 2013 (12%) | |
40-49 Yrs | 783 (11%) | 1264 (10%) | 1688 (10%) | |
50-59 Yrs | 917 (13%) | 1529 (12%) | 1859 (11%) | |
60-69 Yrs | 773 (11%) | 1553 (12%) | 1952 (12%) | |
70+ Yrs | 818 (11%) | 1511 (11%) | 1895 (12%) | |
Median HH Income | $48,137 | $49,947 | $51,617 | |
Total Household Income | < 24K | 785 (29%) | 1267 (25%) | 1451 (23%) |
25-49K | 600 (22%) | 1198 (24%) | 1503 (24%) | |
50-74K | 493 (18%) | 1017 (20%) | 1231 (20%) | |
75-99K | 469 (17%) | 785 (15%) | 920 (15%) | |
100-199K | 258 (9%) | 533 (10%) | 781 (12%) | |
200K+ | 78 (2%) | 126 (2%) | 171 (2%) | |
Highest Education Level | No Diploma | 497 | 942 | 1186 |
Diploma or GED | 1644 | 2912 | 3586 | |
Some College | 1179 | 1914 | 2325 | |
Assoc. Degree | 459 | 972 | 1242 | |
Bachelors Degree | 659 | 1180 | 1505 | |
Higher Degree | 340 | 581 | 710 | |
Total Housing Units | 2,979 | 5,314 | 6,527 | |
--Owner-Occupied | 1,356 | 2,775 | 3,647 | |
--Renter-Occupied | 1,327 | 2,151 | 2,410 | |
Owner-Occupied Values | < 100K | 369 | 702 | 858 |
100-199K | 675 | 1299 | 1601 | |
200-299K | 201 | 569 | 890 | |
300-399K | 43 | 86 | 132 | |
400-499K | 56 | 100 | 138 | |
500K+ | 11 | 21 | 28 | |
Total Working Age Population | 5,794 | 10,272 | 12,815 | |
In Work Force | 3,820 | 6,623 | 8,242 | |
Not In Work Force | 1,974 | 3,650 | 4,573 | |
Workforce Employed | 3,717 | 6,362 | 7,970 | |
Workforce Unemployed | 103 | 260 | 272 | |
Civlian Workforce | 3,820 | 6,623 | 8,242 | |
Military Workforce | 0 | 0 | 0 | |
Total Households | 2,683 | 4,926 | 6,057 | |
Family Households | 1,344 | 2,615 | 3,349 | |
Non-Family Households | 1,339 | 2,311 | 2,708 | |
Married Couple | 988 | 1,987 | 2,622 | |
Other Family | 355 | 628 | 726 | |
Married w/Child | 348 | 764 | 1,064 | |
Single Male w/Child | 81 | 129 | 130 | |
Single Female w/Child | 66 | 175 | 210 |
Population Change Last Two Decades - Plus Projection
2000 | % | 2010 | % | 2020 | % | 2030 | |
---|---|---|---|---|---|---|---|
Colorado | 4,301,261 | +17 | 5,029,196 | +16 | 5,838,181 | +15 | 6,733,658 |
Logan County | 20,504 | +11 | 22,709 | -1 | 22,430 | +12 | 25,113 |
Total Working Age Population:
Total Households:
Total Working Age Population:
Total Households:
Total Working Age Population:
Total Households: