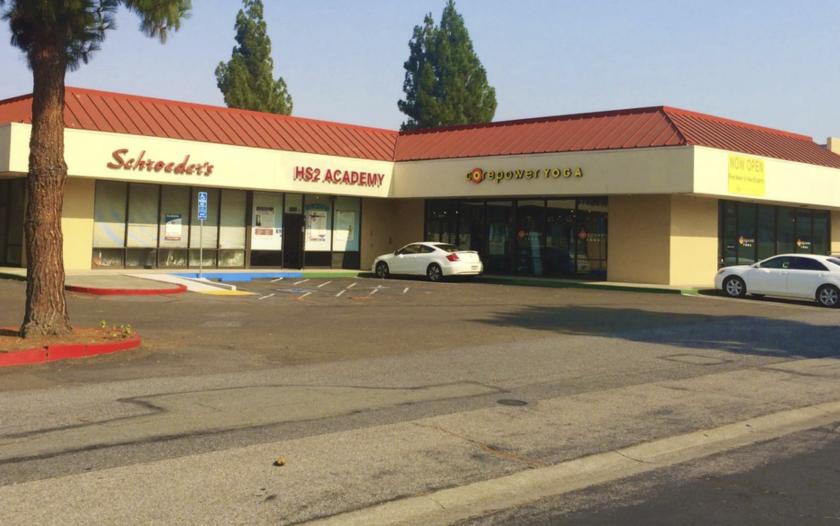
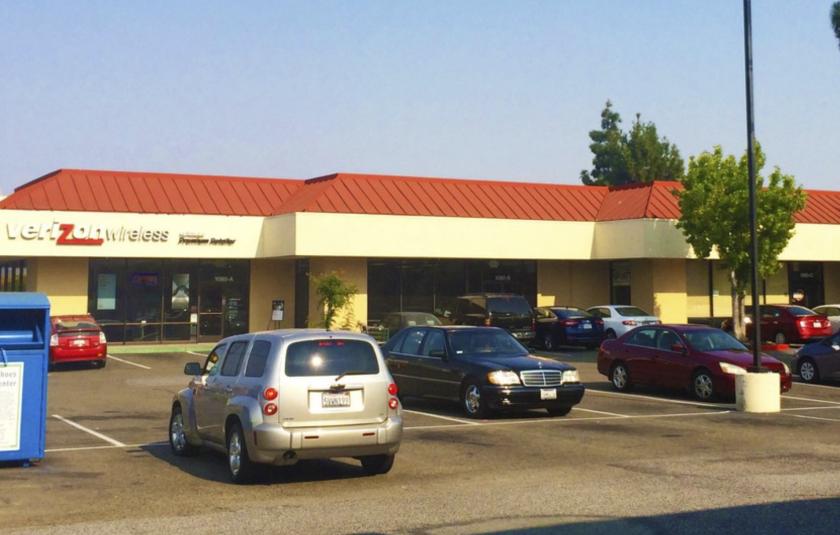
1-Mile | 3-Miles | 5-Miles | ||
---|---|---|---|---|
Total Population | 23,610 | 194,853 | 444,527 | |
Population Median Age | 38 | 38 | 38 | |
Population by Age | 0-9 Yrs | 3178 (13%) | 25808 (13%) | 57256 (12%) |
10-19 Yrs | 2803 (11%) | 24746 (12%) | 56987 (12%) | |
20-29 Yrs | 2783 (11%) | 21459 (11%) | 52230 (11%) | |
30-39 Yrs | 3752 (15%) | 28720 (14%) | 65702 (14%) | |
40-49 Yrs | 3107 (13%) | 28229 (14%) | 64369 (14%) | |
50-59 Yrs | 3551 (15%) | 27828 (14%) | 61788 (13%) | |
60-69 Yrs | 2082 (8%) | 19425 (9%) | 45853 (10%) | |
70+ Yrs | 2355 (9%) | 18640 (9%) | 40342 (9%) | |
Median HH Income | $96,552 | $127,638 | $115,704 | |
Total Household Income | < 24K | 1004 (11%) | 5036 (7%) | 14054 (9%) |
25-49K | 1201 (13%) | 7075 (10%) | 17698 (11%) | |
50-74K | 1154 (13%) | 7209 (10%) | 17159 (11%) | |
75-99K | 1113 (12%) | 6876 (10%) | 16620 (11%) | |
100-199K | 2633 (30%) | 21421 (32%) | 45492 (30%) | |
200K+ | 1532 (17%) | 18431 (27%) | 37797 (25%) | |
Highest Education Level | No Diploma | 1515 | 10254 | 35404 |
Diploma or GED | 2928 | 19402 | 48446 | |
Some College | 3452 | 25559 | 56159 | |
Assoc. Degree | 1040 | 10481 | 23813 | |
Bachelors Degree | 4674 | 40793 | 85970 | |
Higher Degree | 2895 | 27670 | 56586 | |
Total Housing Units | 9,163 | 68,375 | 154,669 | |
--Owner-Occupied | 4,027 | 44,810 | 93,018 | |
--Renter-Occupied | 4,610 | 21,239 | 55,802 | |
Owner-Occupied Values | < 100K | 66 | 905 | 2778 |
100-199K | 65 | 711 | 2414 | |
200-299K | 84 | 911 | 2081 | |
300-399K | 275 | 968 | 2333 | |
400-499K | 274 | 1194 | 3160 | |
500K+ | 3262 | 40121 | 80252 | |
Total Working Age Population | 18,550 | 152,678 | 350,308 | |
In Work Force | 12,635 | 104,135 | 238,307 | |
Not In Work Force | 5,915 | 48,543 | 112,002 | |
Workforce Employed | 12,178 | 100,116 | 228,263 | |
Workforce Unemployed | 443 | 3,955 | 9,942 | |
Civlian Workforce | 12,621 | 104,071 | 238,204 | |
Military Workforce | 14 | 64 | 102 | |
Total Households | 8,637 | 66,049 | 148,819 | |
Family Households | 5,874 | 50,394 | 109,930 | |
Non-Family Households | 2,763 | 15,655 | 38,889 | |
Married Couple | 4,345 | 40,034 | 84,781 | |
Other Family | 1,529 | 10,360 | 25,149 | |
Married w/Child | 1,960 | 19,202 | 40,272 | |
Single Male w/Child | 237 | 1,307 | 3,205 | |
Single Female w/Child | 368 | 2,911 | 7,676 |
Population Change Last Two Decades - Plus Projection
2000 | % | 2010 | % | 2020 | % | 2030 | |
---|---|---|---|---|---|---|---|
California | 33,871,648 | +10 | 37,253,956 | +9 | 40,467,295 | +8 | 43,631,295 |
Santa Clara County | 1,682,585 | +6 | 1,781,642 | +12 | 1,996,394 | +10 | 2,194,079 |
Santa Cruz County | 255,602 | +3 | 262,382 | +6 | 278,997 | +6 | 296,728 |
Total Working Age Population:
Total Households:
Total Working Age Population:
Total Households:
Total Working Age Population:
Total Households: