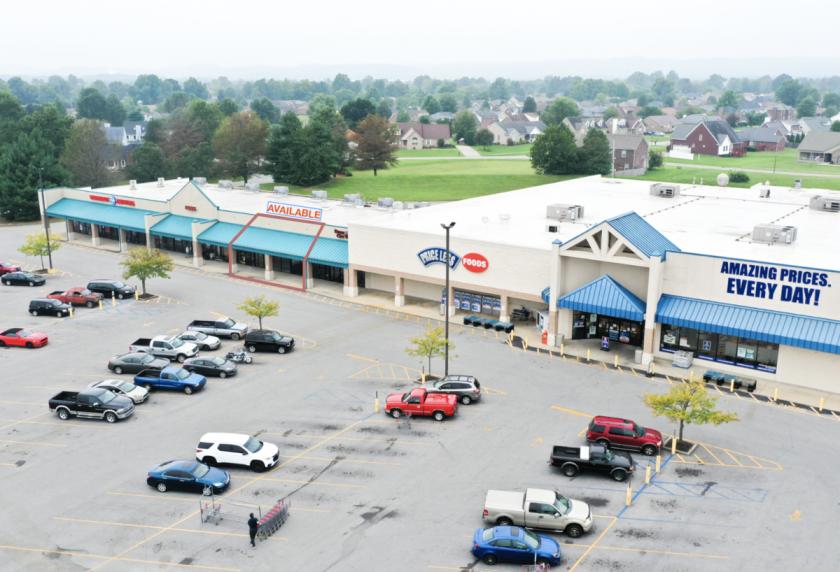
Retail Space
135 Cs-5007 Louisville, KY 40229
135 Cs-5007 Louisville, KY 40229
Details & Description
Property Highlights
- • Two 2 1,500 units
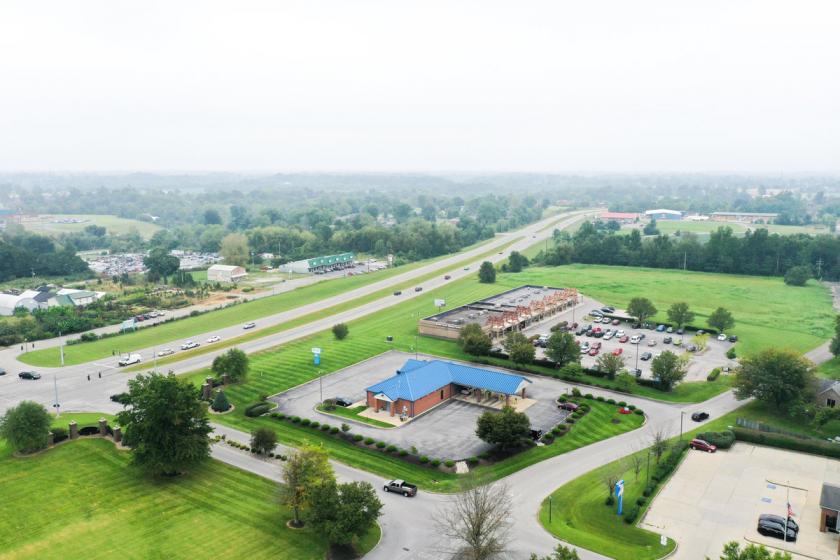
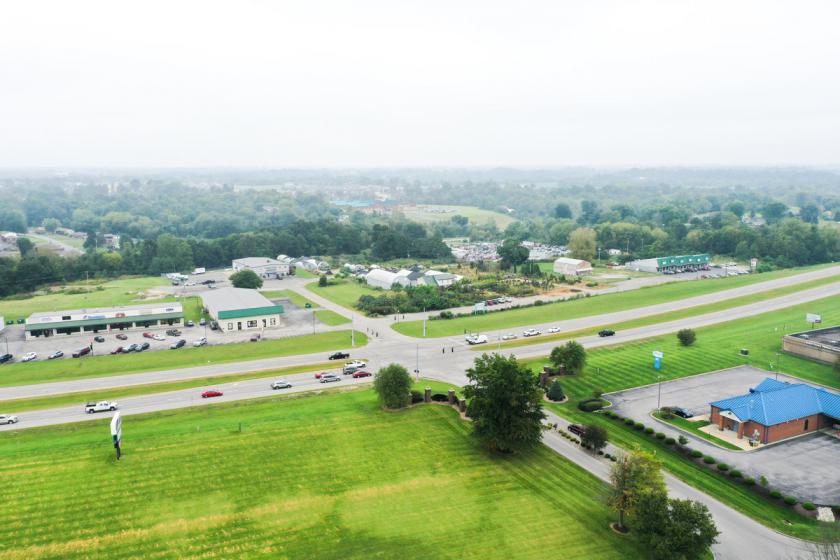
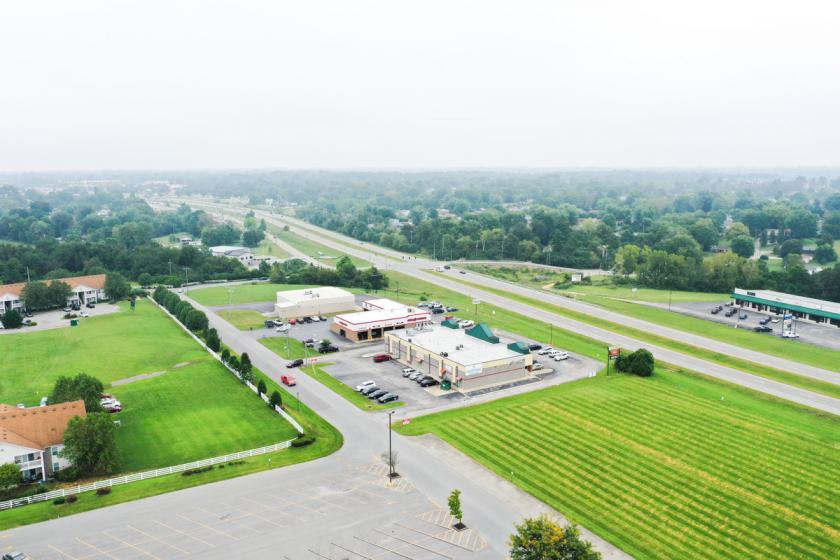
- • Located off N Preston Hwy 17K ADT
- • Approx 3 miles 9 minutes from Gene Snyder 87K ADT
- • Approx 3 miles 9 minutes from I-65 103K ADT
Additional Photos
Listing Agents

Theresa Carnes
O: 502-454-0911
M: 502-408-4930
mtabor@triocpg.com
O: 502-454-0911
M: 502-408-4930
mtabor@triocpg.com
While we strive to provide the most accurate information, all listing information, and demographic data, is provided by third-parties. As such, MyEListing will not be responsible for the accuracy of the information. It is strongly recommended that you verify all information with the listing agent, and any relevant agencies, prior to making any decisions.


