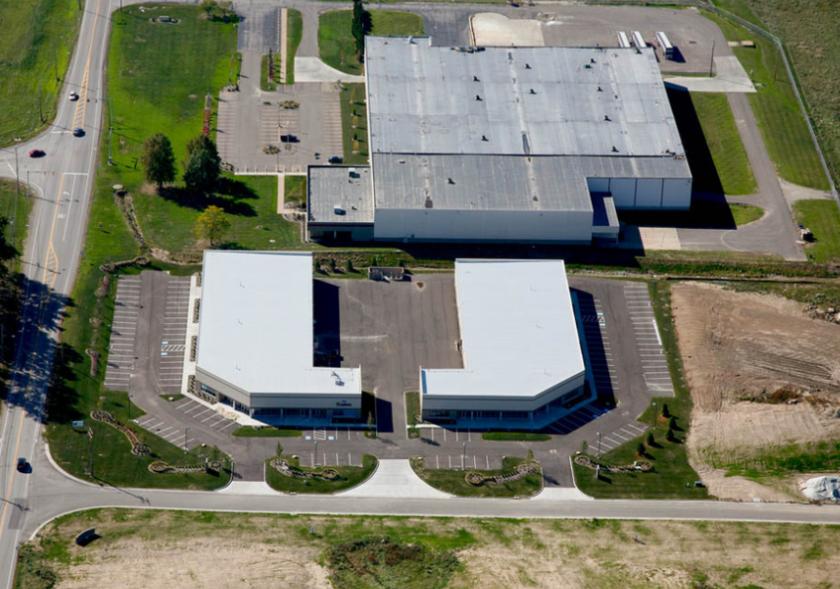
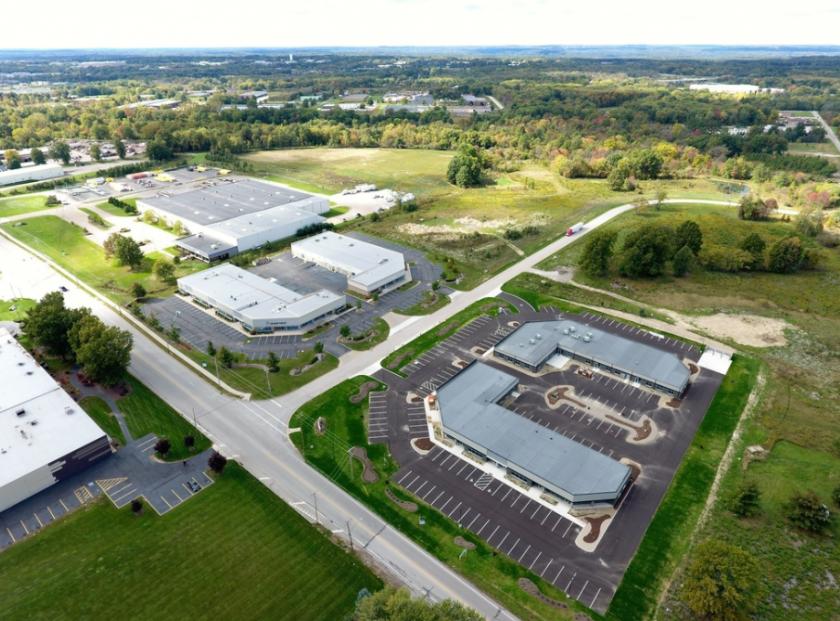
1-Mile | 3-Miles | 5-Miles | ||
---|---|---|---|---|
Total Population | 3,206 | 43,084 | 113,441 | |
Population Median Age | 41 | 40 | 41 | |
Population by Age | 0-9 Yrs | 368 (11%) | 4889 (11%) | 12393 (10%) |
10-19 Yrs | 355 (11%) | 5575 (12%) | 13831 (12%) | |
20-29 Yrs | 426 (13%) | 5380 (12%) | 14392 (12%) | |
30-39 Yrs | 418 (13%) | 5650 (13%) | 14621 (12%) | |
40-49 Yrs | 460 (14%) | 5073 (11%) | 13558 (11%) | |
50-59 Yrs | 409 (12%) | 6046 (14%) | 16374 (14%) | |
60-69 Yrs | 355 (11%) | 4928 (11%) | 14443 (12%) | |
70+ Yrs | 415 (12%) | 5543 (12%) | 13829 (12%) | |
Median HH Income | $62,450 | $73,210 | $69,849 | |
Total Household Income | < 24K | 83 (6%) | 2280 (12%) | 7014 (14%) |
25-49K | 408 (31%) | 3418 (19%) | 9487 (20%) | |
50-74K | 260 (20%) | 3339 (18%) | 8831 (18%) | |
75-99K | 200 (15%) | 2594 (14%) | 6800 (14%) | |
100-199K | 263 (20%) | 4651 (26%) | 11610 (24%) | |
200K+ | 73 (5%) | 1403 (7%) | 3576 (7%) | |
Highest Education Level | No Diploma | 88 | 1336 | 3529 |
Diploma or GED | 739 | 6594 | 18984 | |
Some College | 446 | 5476 | 15162 | |
Assoc. Degree | 127 | 2566 | 7014 | |
Bachelors Degree | 534 | 8751 | 22623 | |
Higher Degree | 326 | 5336 | 13504 | |
Total Housing Units | 1,425 | 18,746 | 50,232 | |
--Owner-Occupied | 812 | 12,063 | 32,317 | |
--Renter-Occupied | 477 | 5,623 | 15,002 | |
Owner-Occupied Values | < 100K | 60 | 1182 | 4210 |
100-199K | 502 | 5531 | 14633 | |
200-299K | 200 | 3491 | 7675 | |
300-399K | 34 | 1224 | 3166 | |
400-499K | 12 | 385 | 1322 | |
500K+ | 4 | 250 | 1311 | |
Total Working Age Population | 2,608 | 34,776 | 92,742 | |
In Work Force | 1,774 | 23,209 | 61,838 | |
Not In Work Force | 833 | 11,567 | 30,904 | |
Workforce Employed | 1,722 | 22,305 | 59,537 | |
Workforce Unemployed | 52 | 838 | 2,212 | |
Civlian Workforce | 1,774 | 23,143 | 61,749 | |
Military Workforce | 0 | 66 | 89 | |
Total Households | 1,289 | 17,686 | 47,318 | |
Family Households | 905 | 11,550 | 30,105 | |
Non-Family Households | 384 | 6,136 | 17,213 | |
Married Couple | 652 | 9,154 | 24,210 | |
Other Family | 253 | 2,396 | 5,895 | |
Married w/Child | 201 | 3,350 | 9,046 | |
Single Male w/Child | 42 | 376 | 817 | |
Single Female w/Child | 118 | 1,076 | 2,334 |
Population Change Last Two Decades - Plus Projection
2000 | % | 2010 | % | 2020 | % | 2030 | |
---|---|---|---|---|---|---|---|
Ohio | 11,353,140 | +2 | 11,536,504 | 0 | 11,574,870 | 0 | 11,615,100 |
Portage County | 152,061 | +6 | 161,419 | 0 | 161,410 | -2 | 158,930 |
Summit County | 542,899 | 0 | 541,781 | -1 | 534,150 | -1 | 528,990 |
Total Working Age Population:
Total Households:
Total Working Age Population:
Total Households:
Total Working Age Population:
Total Households: