Retail Space
3875 Massillon Road Uniontown, OH 44685
3875 Massillon Road Uniontown, OH 44685

Details & Description
Property Highlights
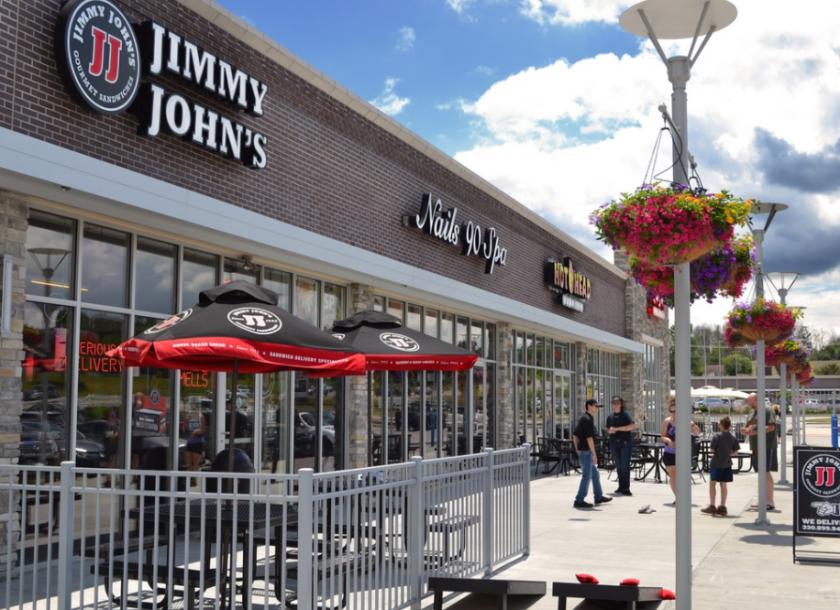
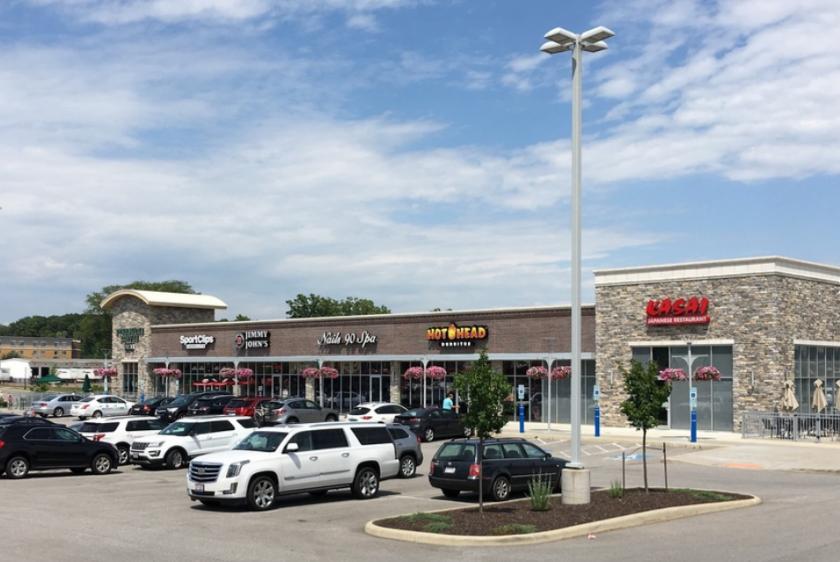
- • Great Tenant Mix
- • High-end Curb Appeal
- • Easily Accessible
- • Close to I-77
- • Ample Parking
- • Highly Visibile
Listing Agents

Dan McCall
O: 330-344-9136
dmccall@albrechtinc.com
O: 330-344-9136
dmccall@albrechtinc.com
While we strive to provide the most accurate information, all listing information, and demographic data, is provided by third-parties. As such, MyEListing will not be responsible for the accuracy of the information. It is strongly recommended that you verify all information with the listing agent, and any relevant agencies, prior to making any decisions.