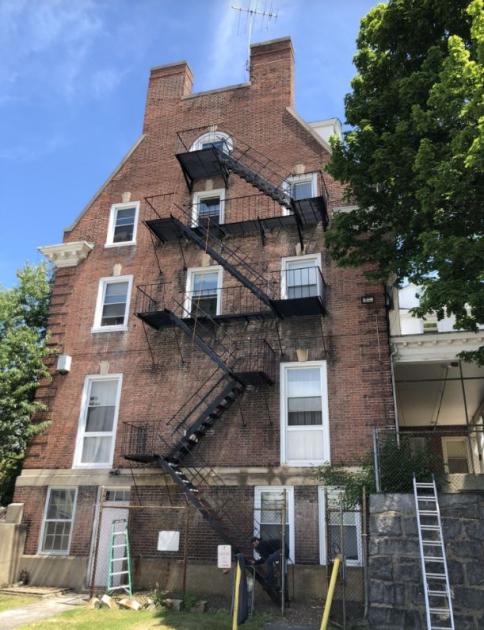
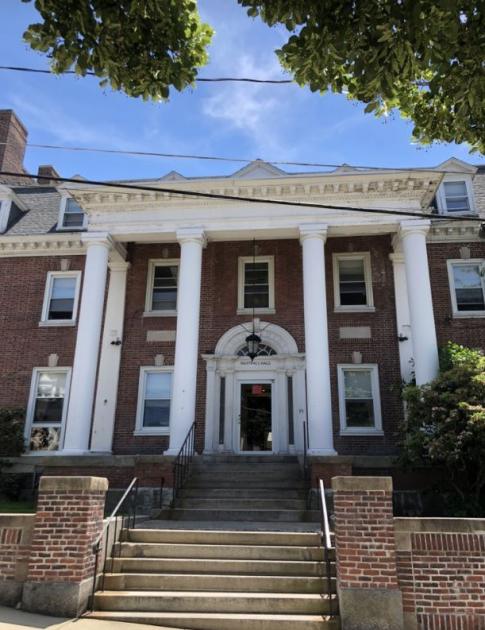
Multifamily Housing
35 Holt Street Fitchburg, MA 01420
35 Holt Street Fitchburg, MA 01420
Details & Description
Property Highlights
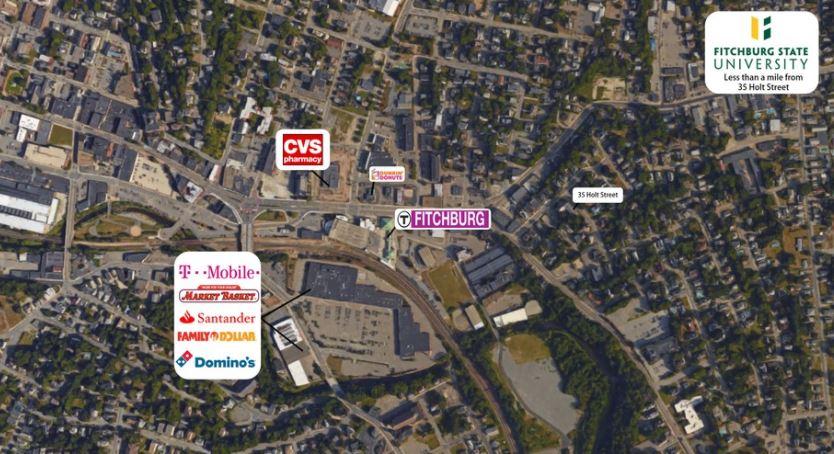
• Nearby amenities include the Fitchburg commuter rail, Dunkin Donuts, CVS, City Hall and more
• Located a mile from Fitchburg State University and surrounding Main Street businesses
Listing Agents

Alex Wood
O: 508-271-9251
M: 508-265-5205
alex.wood@svn.com
O: 508-271-9251
M: 508-265-5205
alex.wood@svn.com
While we strive to provide the most accurate information, all listing information, and demographic data, is provided by third-parties. As such, MyEListing will not be responsible for the accuracy of the information. It is strongly recommended that you verify all information with the listing agent, and any relevant agencies, prior to making any decisions.