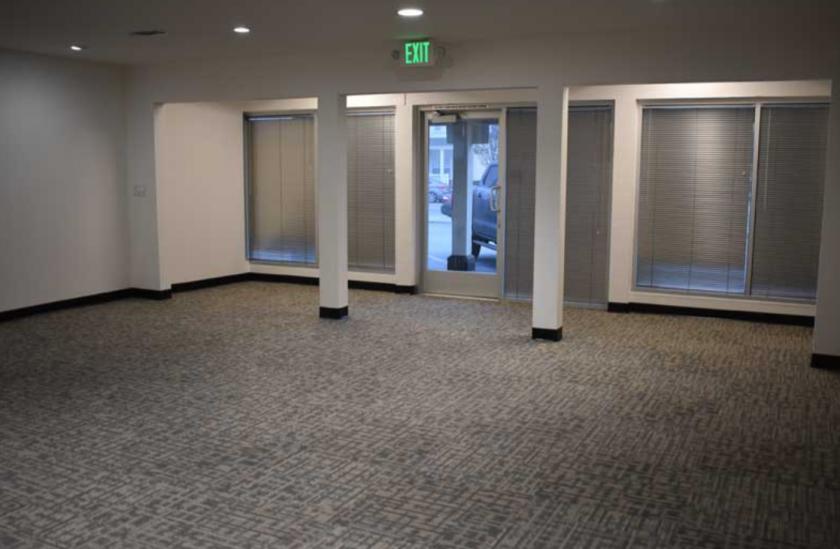
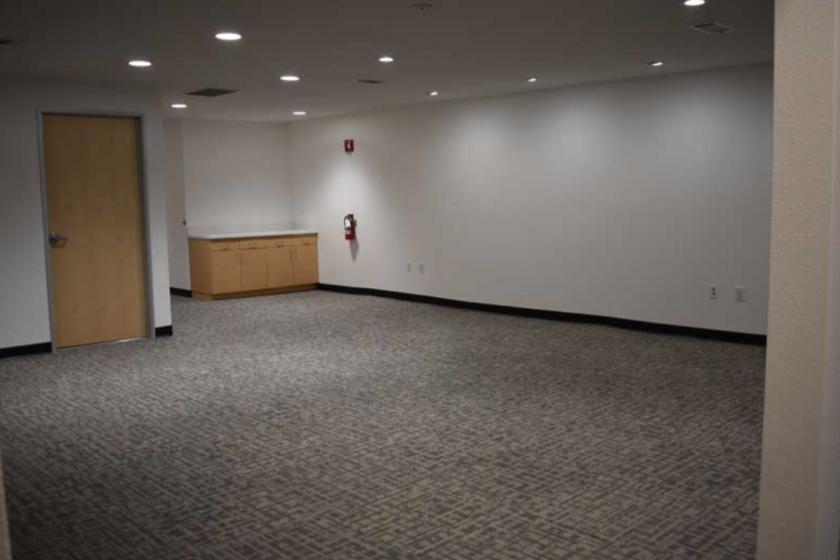
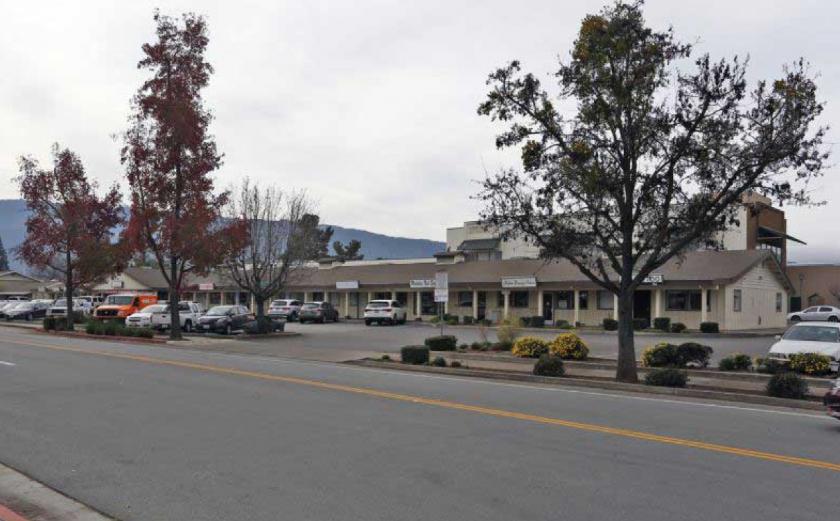
1-Mile | 3-Miles | 5-Miles | ||
---|---|---|---|---|
Total Population | 16,176 | 54,315 | 63,321 | |
Population Median Age | 35 | 35 | 36 | |
Population by Age | 0-9 Yrs | 2492 (15%) | 7832 (14%) | 8871 (14%) |
10-19 Yrs | 2323 (14%) | 9051 (16%) | 10219 (16%) | |
20-29 Yrs | 2493 (15%) | 6901 (12%) | 7862 (12%) | |
30-39 Yrs | 2091 (12%) | 7707 (14%) | 8802 (13%) | |
40-49 Yrs | 1991 (12%) | 7772 (14%) | 8906 (14%) | |
50-59 Yrs | 2224 (13%) | 6541 (12%) | 7971 (12%) | |
60-69 Yrs | 1341 (8%) | 4766 (8%) | 6010 (9%) | |
70+ Yrs | 1222 (7%) | 3745 (6%) | 4680 (7%) | |
Median HH Income | $93,251 | $97,848 | $101,210 | |
Total Household Income | < 24K | 456 (9%) | 1451 (9%) | 1618 (8%) |
25-49K | 721 (14%) | 2378 (15%) | 2716 (15%) | |
50-74K | 801 (16%) | 2053 (13%) | 2382 (13%) | |
75-99K | 716 (14%) | 1969 (12%) | 2219 (12%) | |
100-199K | 1739 (34%) | 5137 (33%) | 5957 (32%) | |
200K+ | 567 (11%) | 2374 (15%) | 3176 (17%) | |
Highest Education Level | No Diploma | 1548 | 7242 | 8197 |
Diploma or GED | 2350 | 7176 | 8481 | |
Some College | 2788 | 8316 | 9671 | |
Assoc. Degree | 920 | 2530 | 2967 | |
Bachelors Degree | 1605 | 5591 | 7076 | |
Higher Degree | 963 | 2841 | 3558 | |
Total Housing Units | 5,232 | 15,890 | 18,823 | |
--Owner-Occupied | 2,776 | 9,217 | 11,210 | |
--Renter-Occupied | 2,223 | 6,144 | 6,858 | |
Owner-Occupied Values | < 100K | 46 | 257 | 285 |
100-199K | 19 | 161 | 183 | |
200-299K | 72 | 361 | 361 | |
300-399K | 93 | 346 | 387 | |
400-499K | 279 | 898 | 970 | |
500K+ | 2267 | 7194 | 9023 | |
Total Working Age Population | 12,073 | 40,552 | 47,821 | |
In Work Force | 8,768 | 28,528 | 33,235 | |
Not In Work Force | 3,304 | 12,024 | 14,586 | |
Workforce Employed | 8,311 | 26,893 | 31,393 | |
Workforce Unemployed | 457 | 1,635 | 1,842 | |
Civlian Workforce | 8,768 | 28,528 | 33,235 | |
Military Workforce | 0 | 0 | 0 | |
Total Households | 4,999 | 15,361 | 18,068 | |
Family Households | 3,873 | 12,125 | 14,291 | |
Non-Family Households | 1,126 | 3,236 | 3,777 | |
Married Couple | 2,530 | 8,499 | 10,256 | |
Other Family | 1,343 | 3,626 | 4,035 | |
Married w/Child | 1,066 | 4,182 | 4,858 | |
Single Male w/Child | 251 | 566 | 628 | |
Single Female w/Child | 541 | 1,360 | 1,476 |
Population Change Last Two Decades - Plus Projection
2000 | % | 2010 | % | 2020 | % | 2030 | |
---|---|---|---|---|---|---|---|
California | 33,871,648 | +10 | 37,253,956 | +9 | 40,467,295 | +8 | 43,631,295 |
San Benito County | 53,234 | +4 | 55,269 | +13 | 62,346 | +11 | 69,120 |
Santa Clara County | 1,682,585 | +6 | 1,781,642 | +12 | 1,996,394 | +10 | 2,194,079 |
Santa Cruz County | 255,602 | +3 | 262,382 | +6 | 278,997 | +6 | 296,728 |
Total Working Age Population:
Total Households:
Total Working Age Population:
Total Households:
Total Working Age Population:
Total Households: